Today, Bitcoin took a steep plummet as it dropped by around 19% to reach as low as $46,735. The coin has since recovered pretty quickly and is now trading back above $52,000.
It is important to understand that, despite Bitcoin printing consistent gains over the past few months, the cryptocurrency is still very vulnerable to sharp falls in price that we have just seen today. Nevertheless, with the increased optimism in the market, driven by institutional demand, we can be certain that any dips like this are going to be bought up relatively quickly – such as what we saw today.
Today, on Week 8, we will be covering our top picks to watch, which are DOT, CAKE, and BTC:
To find out these projects in a little more detail and why we chose them, take a look at the article here.
In this analysis, I would like to cover these four coins to help provide some areas of support and resistance you might expect moving forward.
Polkadot (DOT) Price Analysis
What has been going on?
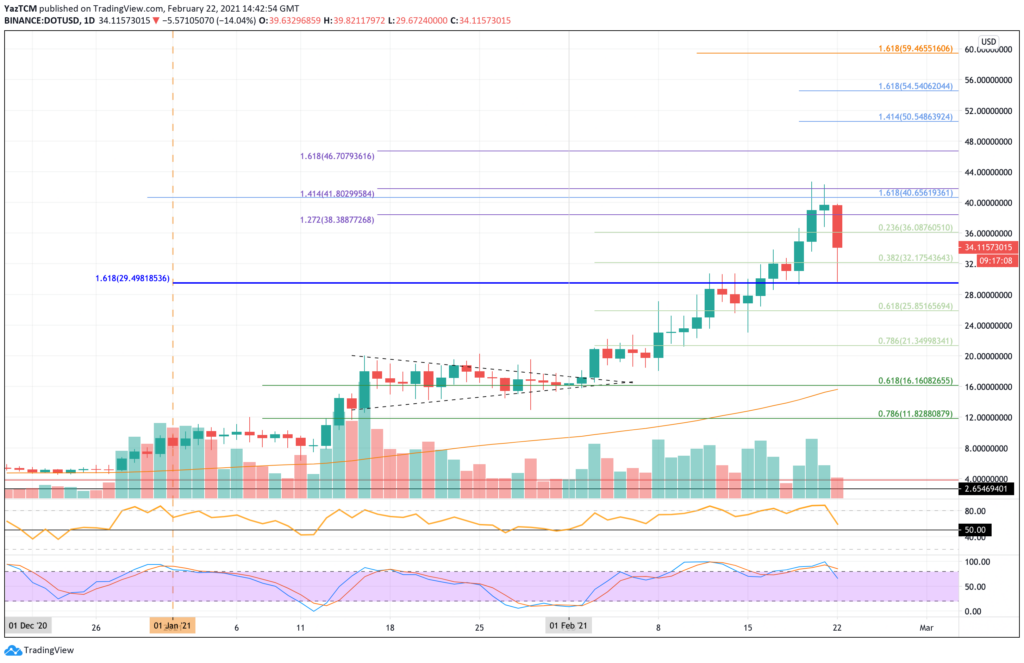
Despite today’s 8.5% price drop, DOT is still up by a whopping 114% over the past month as it sits in the 5th ranked position with a total market cap value of 32.84 billion. The cryptocurrency had broken out of a symmetrical triangle pattern at the start of February 2021 as it started to push higher.
By mid-February, DOT had met resistance at $29.50 (1.618 Fib Extension) and stalled there for a few days. This resistance was finally broke last week, which allowed DOT to continue higher and set a new ATH price at $42.71 over the weekend. More specifically, DOT could not manage to close a daily candle above the $40 level.
Today the BTC price drop caused DOT to sink back into the previous resistance at $29.50. It has since rebounded and is now trading around $34.11.
DOT price short term prediction: Bullish
DOT still remains bullish in the short term. A drop beneath $20 would be required to turn the market neutral, and it would have to continue beneath $16 (100-day EMA) to be in danger of turning bearish.
Looking ahead, the first level of support lies at $32.18 (.382 Fib Retracement). This is followed by $29.50, $28, $25.85 (.618 Fib Retracement), and $21.34.
Added support lies at $20 and $160 (100-day EMA).
Where is the resistance toward the upside?
On the other side, the first level of strong resistance lies at $38.38. This is followed by $40. Above $40, resistance lies at the ATH price of $42.71, $44, and $46.70 (1.618 Fib extension – purple).
Additional resistance is found at $48, $50, $50.55, $52, and $54.54.
Pancake Swap (CAKE) Price Analysis
What has been going on?
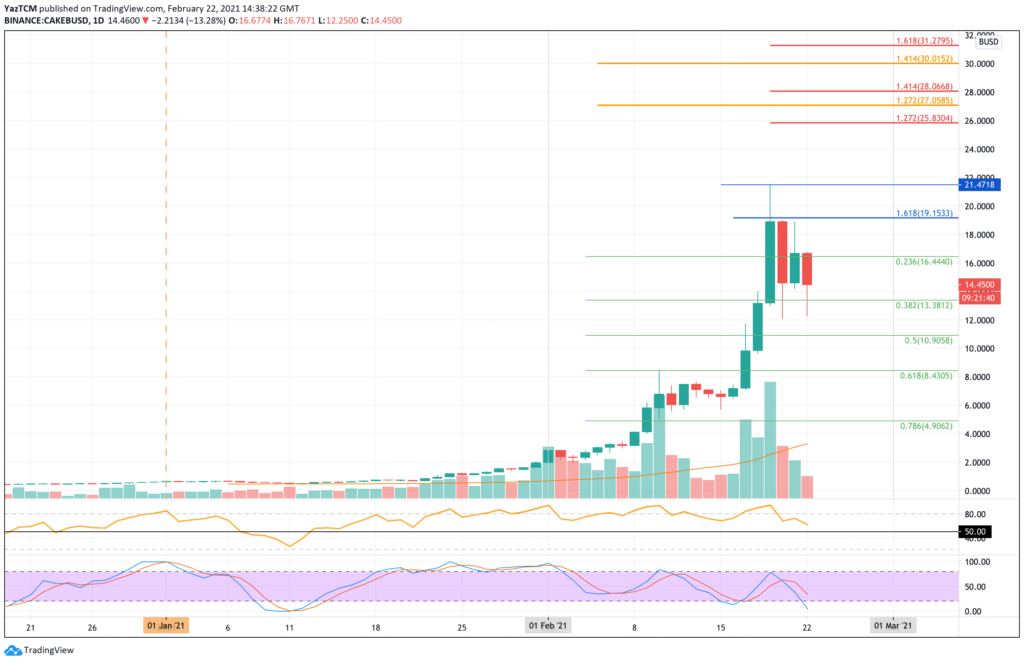
CAKE dropped by a sharp 20% today but is still up by a strong 120% over the past month of trading. It is currently ranked in the 48th position as it holds a $1.80 billion market cap value.
The cryptocurrency had surged higher from $6.00 during mid-Feb, and it continued higher to set a new ATH price at $21.47 on Friday. More specifically, it could not close a daily candle above resistance at $19.15 (1.618 Fib Extension) and rolled over from there.
Over the past two days, CAKE has done well to hold the support at $14.50. Today’s price drop saw the coin falling as low as $12, but it has since recovered to $14.45.
CAKE price short term prediction: Bullish
CAKE still remains bullish in the short term. To turn neutral, it would need to fall beneath the support at $8.43 (.618 Fib Retracement). To turn bearish, it would need to continue beneath $4.00.
If the sellers push lower, the first support lies at $13.38 (.382 Fib Retracement). This is followed by $12, $10.90 (.5 Fib Retracement), $10, and $8.43 (.618 Fib Retracement).
Where is the resistance toward the upside?
On the other side, the first level of resistance lies at $18. This is followed by $19.15, $20, and $21.47 (ATH price). Above the ATH, resistance is located at $24, $26, $27, and $28.
Bitcoin (BTC) Price Analysis
What has been going on?
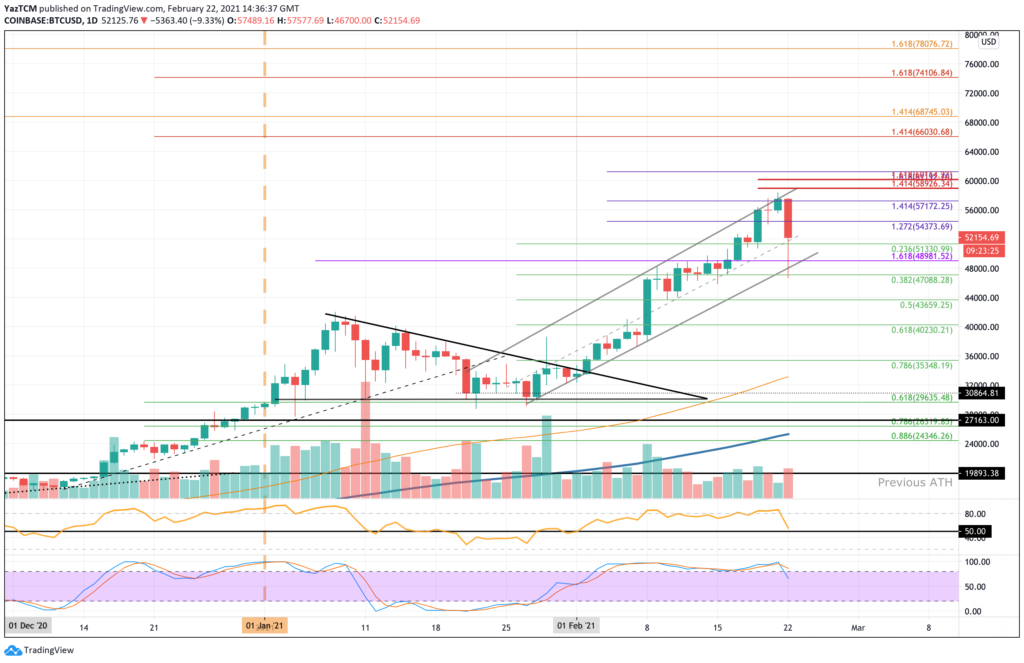
Bitcoin saw a very interesting 24 hour period in which the coin dropped by almost 20% as it sank as low as $46,735. The cryptocurrency has quickly recovered and is currently trading above $52,000 again.
For the period of February 2021, BTC has been trading within an ascending price channel. Over the weekend, the coin reached the upper boundary of this price channel and could not break above it. Today, we can see that the steep price drop caused BTC to fall into the support at $47.100, provided by a .382 Fib Retracement.
It quickly recovered and is now trading above the midline of this ascending price channel again. Bitcoin has not slipped beneath the midline of this price channel since February 8th.
BTC price short term prediction: Bullish
Despite the steep price spike lower, BTC still remains strongly bullish in the short term. To turn neutral, Bitcoin would need to drop beneath $40,000 (.618 Fib Retracement). To turn bearish, Bitcoin would need to continue beneath $30,000.
If the sellers push lower, the first level of support lies at $51,330 (.236 Fib Retracement & midline of the price channel). This is followed by $48,981 (lower boundary of the price channel), $48,000, and $47,100 (.382 Fib Retracement).
Added support lies at $43,660 (.5 Fib Retracement), $40,000 (.618 Fib Retracement), and $36,000.
Where is the resistance toward the upside?
On the other side, the first level of resistance lies at $54,373. This is followed by $56,000, $57,172, and then the upper boundary of the price channel.
Added resistance lies at $60,000, $61,000, $64,000, and $66,030.