Key highlights:
- KuCoin Token (KCS) might be down 18% on the month but is still up over 60% from the recent capitulation low.
- During the industry-wide selloff, KCS dipped as low as $9.55 but has since rebounded to the current $15.50 level.
- A break above $17 could send KCS back toward the March 22’ highs at $22.
| KCS price | $15.43 |
| Key KCS resistance levels | $16, $16.82, $17, $18, $19, $20 |
| Key KCS support levels | $15.33, $15, $14.22, $13.33, $12.43, $10.72, $10 |
KCS is down 18% from the highs above $21 seen last month, but the cryptocurrency is still performing strongly relative to the entire crypto market. The coin dipped from above $18 at the start of May to plummet as low as 49.55 during the capitulation seen earlier in the month.
Since hitting the low, KCS has rebounded quite aggressively and is now up 60%. Earlier in the week, KCS pushed higher above $16 to meet the resistance at $17 (bearish .618 Fib Retracement). Unfortunately, it was unable to overcome this resistance and has since retraced into the .236 Fib Retracement level at $15.33.
KuCoin, known as the “People’s Exchange,” recently surpassed the 10 million users milestone as it continues to become a leading, top-tier exchange. It is known as the People’s Exchange because KCS holders receive a share of the day-to-day revenues as a bonus.
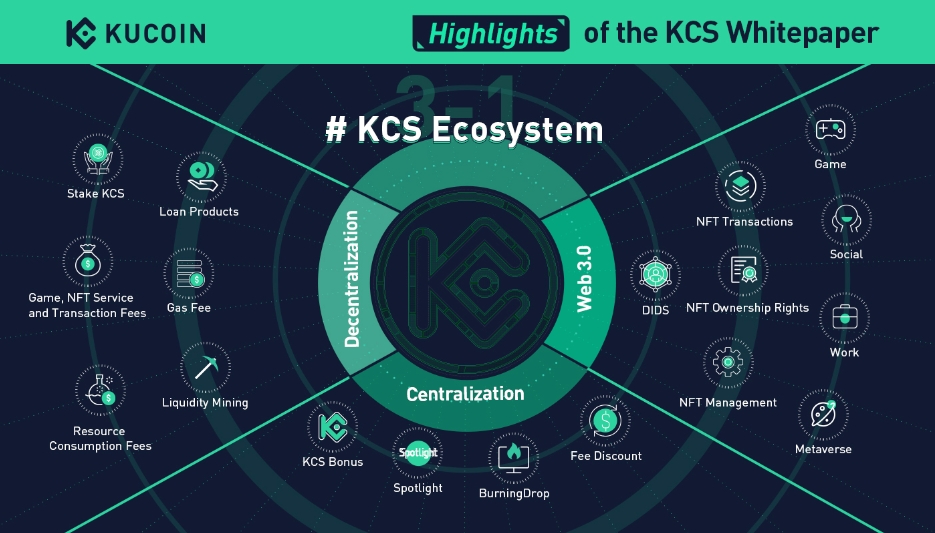
The excitement continues to grow for KuCoin as investors look ahead to the growth of the entire KCS ecosystem through the KuCoin Community Chain. The team released a KCS Whitepaper toward the end of March to provide details regarding the upcoming KCC, which will be powered by the native currency KCS.
The introduction of KCC would bring the entire KuCoin ecosystem into the DeFi sector, allowing features such as gaming, NFTs, decentralized finance, and liquidity mining to emerging. The entire KCC chain will be EVM compatible, meaning that all Ethereum dApps are easily able to migrate to the new chain;
Furthermore, the whitepaper also detailed an upcoming KCS token burn. According to the whitepaper, 20 million KCS, worth around $400 million, would be directly burned. As a result, a total of over 54.1 million KCS tokens have now been burnt since inception.
Interestingly, we can see the social sentiment increasing quite rapidly for KuCoin. Recent data from LunarCrush shows that the total social contributors metric hit a 3-month high after reaching a daily record of 4,260 unique contributors;
With the social community around KuCoin buzzing, all eyes are fixed on the $17 for an upside break to continue to relatively remarkable comeback for KCS during a bear period.
KuCoin Token is now ranked in the 53rd position as it currently holds a $1.24 billion market cap.
KuCoin Token (KCS) Price Analysis
What has been going on?
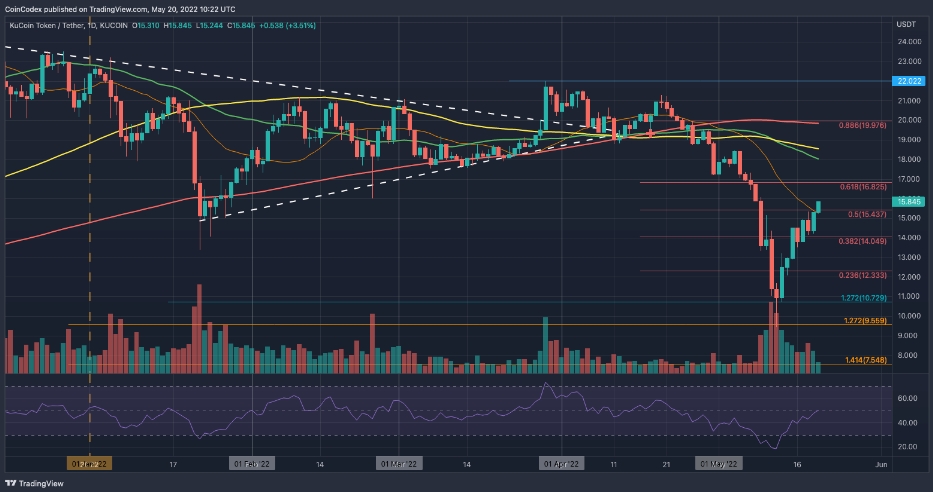
Looking at the daily chart above, we can clearly see that support around $10.73 (downside 1.272 Fib Extension) helped prevent the market from steep declines following the mid-May market capitulation. It did spike as low as $9.55, but this was short-lived as the buyers quickly regrouped to close the low-day closing candle above $10.73.
Since hitting the low, KCS has posted a remarkable recovery. Over the two-week period where BTC was trapped inside a range, KCS went on to post higher highs as it made its way toward $17. At the start of this week, KCS broke above the 21-day MA at $15, allowing it to continue higher until hitting resistance at $17 (bearish .618 Fib Retracement).
Unfortunately, it has been unable to break $17 so far and has since retraced to the .236 Fib Retracement at around $15.33.
KuCoin Token (KCS) price short term prediction: NEUTRAL
The aggressive rebound has allowed KCS to turn neutral with the break above the 21-day MA. However, to remain neutral, KCS would need to hold above $15.50. A break beneath here would turn the market bearish again.
To turn bullish, KCS would still need to climb higher and break the resistance at $20, provided by the 200-day MA level. A clean break above $22 would confirm a longer termed bull trend has been established.
Where can we go from here?
The previous bullish momentum is starting to show some signs of fading after hitting $17. We will need to see how deep the current retracement plays out before having more of an idea of where KCS will be heading.
If the retracement is short-lived and KCS rebounds from the current $15.33 support, the first strong resistance lies directly at $17 (bearish .618 Fib Retracement). Above this, resistance is expected at $18 (100-day MA), $19.23 (1.272 Fib Extension level), and $20 (bearish .886 Fib Retracement & 200-day MA).
On the other side, if the sellers push beneath $15, the first level of support lies at $14.50 (21-day MA). This is followed by added support at $14.22 (.382 Fib Retracement), $13.33 (.5 Fib Retracement), $12.43 (.618 Fib Retracement), and $10.73 (downside 1.272 Fib Extension).
What Are The Technical Indicators Showing?
This week’s rally higher toward $17 allowed the RSI to climb higher. It briefly broke above the midline when the market met the resistance. However, since then, the RSI has started to head lower as it crossed back beneath the midline – indicating indecision within the market.
If the RSI starts to head lower again, this will indicate that the bearish momentum is beginning to reappear, and we can expect the retracement to be deeper. On the other hand, if the RSI can climb higher beyond the midline, the bullish momentum will increase, and could carry KCS above $17.