In the world of crypto trading, candlestick patterns are powerful indicators that can help traders make informed decisions and predict future price movements. Whether you are a beginner or an experienced trader, understanding these patterns is essential for maximizing profits and minimizing risks. In this article, I will take you on a journey through the fascinating world of candlestick patterns in crypto trading, exploring their origins, importance, basic elements, common patterns, interpretation, and strategies. So, let’s dive in and unravel the secrets of this powerful tool!
Understanding Candlestick Patterns
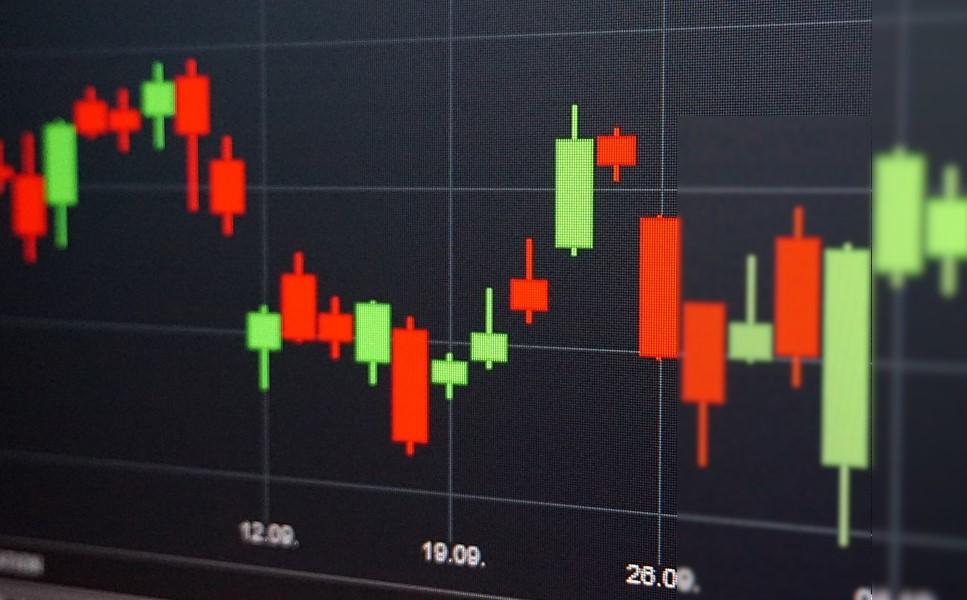
Candlestick patterns have a long and intriguing history, originating in Japan in the 18th century. To better understand their significance, it is crucial to grasp the importance of visual representation in trading. These patterns represent the price movements of an asset over a specific timeframe, typically displayed in a candlestick chart.
The advent of candlestick charting revolutionized the way traders analyze price data. Unlike traditional line charts that present only the closing price, candlestick charts depict the opening, closing, high, and low prices of an asset, allowing traders to gain deeper insights into market dynamics.
The Origin of Candlestick Patterns
Japanese rice traders developed candlestick patterns to analyze price fluctuations in the rice market. They realized that understanding the psychology behind price movements could give them an edge in predicting future trends. Over time, these visual representations evolved into various patterns that are still widely used today.
Nowadays, candlestick patterns have transcended their origins and are applied to various financial markets, including the fast-paced and rapidly-evolving world of cryptocurrency trading.
The Importance of Candlestick Patterns in Trading
Candlestick patterns act as powerful signals, providing traders with valuable insights into market sentiment and potential price reversals. By recognizing these patterns, traders can identify opportunities for entering or exiting trades at favorable moments.
Moreover, candlestick patterns can help traders gauge the strength of a trend, determine levels of support and resistance, and validate the effectiveness of other technical indicators. Being able to interpret these patterns correctly can significantly improve your decision-making process and enhance your trading performance.
Basic Elements of a Candlestick Pattern
Before delving into the intricacies of common candlestick patterns, let’s familiarize ourselves with the basic elements of a candlestick. Each candlestick consists of a body and shadows, providing valuable information about the price action.
The Body and Shadows
The body of the candlestick represents the price range between the opening and closing prices. A bullish candlestick has a body that is usually colored green or white and indicates a price increase. On the other hand, a bearish candlestick has a body that is typically colored red or black and illustrates a price decrease.
Shadows, also known as wicks or tails, extend from the body and indicate the range between the high and low prices. Long shadows imply significant price volatility, while short shadows suggest a more stable market.
The Color Scheme
The colors used to represent bullish and bearish candlesticks can vary depending on the charting software or personal preferences. It is essential to choose colors that are visually appealing and help you quickly identify bullish and bearish signals.
Now that we have grasped the basics, let’s explore some of the most common candlestick patterns frequently encountered in crypto trading.
Common Candlestick Patterns in Crypto Trading
The Doji Pattern
The Doji pattern is a significant indicator of market indecision. It occurs when the opening and closing prices are very close or nearly identical, resulting in a candlestick with a small body. This pattern suggests that neither the bulls nor the bears have control over the market, and a trend reversal may be imminent. Traders often interpret the Doji pattern as a signal to exercise caution and consider other factors before making trading decisions.
The Hammer Pattern
The Hammer pattern is characterized by a small body and a long lower shadow, resembling a hammer. This bullish pattern typically occurs at the end of a downtrend and heralds a potential price reversal. The long lower shadow indicates that bears attempted to push the price down, but bulls ultimately regained control. Seeing a Hammer pattern can be an encouraging sign for traders to enter or hold onto long positions.
The Engulfing Pattern
The Engulfing pattern is a powerful reversal signal that occurs when a candlestick’s body completely engulfs the body of the previous candlestick. A bullish engulfing pattern forms when a green or white candlestick engulfs a preceding red or black candlestick, indicating a shift from bearish to bullish sentiment. Conversely, a bearish engulfing pattern occurs when a red or black candlestick engulfs a preceding green or white candlestick, signaling a shift from bullish to bearish sentiment. This pattern often suggests a change in market direction and can be a useful tool for traders seeking to capitalize on trend reversals.
Interpreting Candlestick Patterns
Bullish vs Bearish Patterns
Candlestick patterns can be broadly categorized as either bullish or bearish. Bullish patterns indicate that buyers are in control and a price increase may occur, while bearish patterns suggest that sellers are dominating and a price decrease may be imminent. It is essential to understand the implications of each pattern and use them in conjunction with other technical indicators to validate your trading decisions.
Reversal and Continuation Patterns
Candlestick patterns can provide valuable insights into potential trend reversals or continuations. Reversal patterns indicate a potential change in the direction of an ongoing trend, while continuation patterns suggest that the current trend is likely to persist. By identifying these patterns correctly, traders can position themselves advantageously and make informed trading choices.
Strategies for Trading with Candlestick Patterns
Timing Your Trades
Timing is critical in trading, and candlestick patterns can help you improve your entry and exit timings. By identifying patterns that align with your trading strategy, you can increase the probability of entering profitable trades and reduce the risk of losses. Combining candlestick patterns with other technical indicators, such as trend lines or moving averages, can further enhance your accuracy in timing your trades.
Combining Candlestick Patterns with Other Indicators
While candlestick patterns are powerful on their own, integrating them with other indicators can provide a more comprehensive view of the market. Technical indicators such as RSI (Relative Strength Index) or MACD (Moving Average Convergence Divergence) can help confirm or validate the signals generated by candlestick patterns, allowing for more accurate predictions. Experimenting with different combinations and finding what works best for your trading style is essential.
Now, armed with a deeper understanding of common candlestick patterns and how to interpret them, you are ready to embark on your journey in the exciting world of crypto trading. However, always remember that trading involves risks, and it is crucial to conduct thorough research, manage your risks appropriately, and continuously educate yourself to navigate the volatile nature of the cryptocurrency market.