Konstantin Anissimov, Executive Director at CEX.IO
The capitalization of the global cryptocurrency market is down by almost 0.7% in what appears as a gradual shed-off of the massive gains recorded in the past 24 hours and since the beginning of the week.
As is obvious based on the imminent volatility in the market, every new pump in price is bound to be accompanied by a reversal, most of which are healthy for a refreshed run. The gradual dip the market appears to be experiencing is based on the price action of the two biggest digital currencies, which are, Bitcoin (BTC), and Ethereum (ETH).
Seeing growths is perhaps a source of delight to market enthusiasts as both cryptocurrencies have wedged through the most difficult of months, paring off gains amidst uncontrolled sell-offs. For Ethereum, the reasons are quite clear, the network fees are reducing its usage and pushing users to alternative blockchain networks while Bitcoin’s struggle is best attributed to early HODLers taking off profits from the skyrocketing runs it made about a month ago.
While both coins appear to be charting different paths for themselves, today’s analysis explores the technicals behind both the retracement being seen, as well as the bull case for imminent near-term growth.
Bitcoin Bears Attempting To Stall Growth
Bitcoin’s market bears, essentially those selling their holdings on cryptocurrency exchanges or other marketplaces, are unrelenting in preventing the joyous ride to new highs. At the time of writing, BTC is trading at $53,950 according to data from CEX.IO price feeds, a slight gain of 0.17% in the past 24 hours. The coin was down in the early hours of trading.
Bitcoin’s rise above $50,000 began on Monday and the ultimate goal is to beat the $56,000 resistance to surge past the previous all-time high price above $58,000. The market bears are making this bullish ride a daunting one despite key institutional investors reporting bullish news about the cryptocurrency.
For instance, the Bitcoin technology solutions provider NYDIG revealed that it had attracted $200 million in a growth capital round led by Stone Ridge Holdings Group, Morgan Stanley, New York Life, MassMutual, Soros Fund Management, and FS Investments. This move is set to usher in a basis for new institutional money flowing into the digital currency. The bears are obviously preventing the bulls from riding on this bullish news.

The BTC-USD chart is somewhat divided when it comes to the direction of the price of Bitcoin. The coin’s price has sliced through the Parabolic SAR indicator, showing a price reversal from the uptrend that has been active since March 6th, 2021. Should the bears be forceful enough to keep the price below this level in the next couple of hours, Bitcoin’s price may fall back below the $50,000 support.
The twists that exist in the market could also spell a renewed vigor for the market bulls. With the RSI still in the buy zone and with a bullish short-term moving average, the price of BTC may touch the $56,000 in the short-term, and $60,000 in the mid-term.
Ethereum Price Not Reflective of ETH 2.0 Smart Contract Deposit Figure
Ethereum (ETH) is shedding off more losses than Bitcoin with a dip of 1.24% at the time of writing to exchange hands at $1,808.90. The inconvenience of the current Proof-of-Work model as mentioned earlier is giving competing networks an edge, a bearish enough scenario for Ethereum.
However, the dip to the abyss may not be sustained in the longer term as on-chain data from Glassnode shows that the total value locked in Ethereum 2.0 smart contract deposit address has hit an all-time high of $6,467,550,120.47, showing the trust in the network’s prospect in the long-term.
But with a dropping price in Ether, governed by the Proof-of-Work model, one could argue that the confidence amongst Ethereum bulls is for the future and not necessarily for the price performance of the coin now. However, when we consider the fact that both networks are going to be working synergistically until full integration into the PoS model, today’s Ethereum will undoubtedly benefit from whatever hype Ethereum 2.0 receiving.
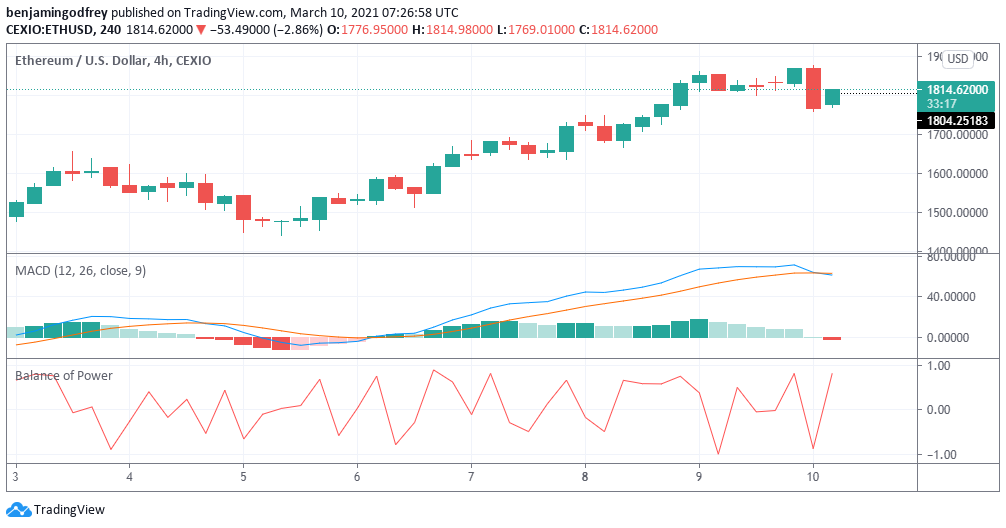
Consider the ETH-USD chart on TradingView, the bulls are poised to take control of the market from the bears, suggesting the on-chain data as described is effective in stirring positive sentiments amongst the market movers.
Per the Balance of Power indicator which is close to the 1.00 high, ETH’s bullish trend is unquestionable, a confirmation of which may be given by the Moving Average Convergence Divergence whose line is seen at par with the signal line. Should the MACD line disengage from the signal line and chart a path upward, Ethereum will undoubtedly break the $2,000 resistance in the short term, and $2,500 will be on the horizon in the mid-term.