Key takeaways:
- Interest rate hike announced by the Fed and disruption of Kazakhstan’s BTC mining operations could be to blame for the recent market pullback
- Litecoin has lost its long-held support level this week and is likely to face more bearish momentum in the coming days
- Market signals suggest a new LTC support level is forming in the $107-$110 range
The cryptocurrency market has seen significant bearish activity over the last week. Bitcoin, Ethereum, Litecoin, and other major digital assets have retraced to price levels not seen since last September.
The combined value of all digital currencies in circulation has plunged from November’s peak of $3 trillion to below $2 trillion on Monday. Litecoin lost its long-held spot among the top 20 largest coins by market capitalization and now ranks 24th with a market valuation of $8.93 billion at press time.
Key reasons behind the market pullback
A series of macroeconomic factors could be to blame for the recent market pullback. For starters, the Federal Reserve has recently announced its plan to raise interest rates and start selling its $8.7 trillion treasury consisting of bonds and other assets “sooner or at a faster pace” than previously anticipated. Expansionary assets, including stocks and digital currencies, responded to the news very negatively – in the case of crypto, the market underwent roughly 10% correction in a matter of hours.
Civil unrest in Kazakhstan, which led to a power outage that caused Bitcoin miners in the country to halt their operations, is another possible reason behind the negative sentiment permeating the markets as of late. After Beijing officials banned crypto mining in the country in 2021, a large portion of mining operations found a new home in the central Asian country. According to recent reports, Kazakhstan is the second-largest BTC mining hub in the world, accounting for roughly 18% share of the global BTC hash rate, trailing only the US that accounts for 35% of the global hash rate.
Technical Analysis: LTC/USDT daily chart
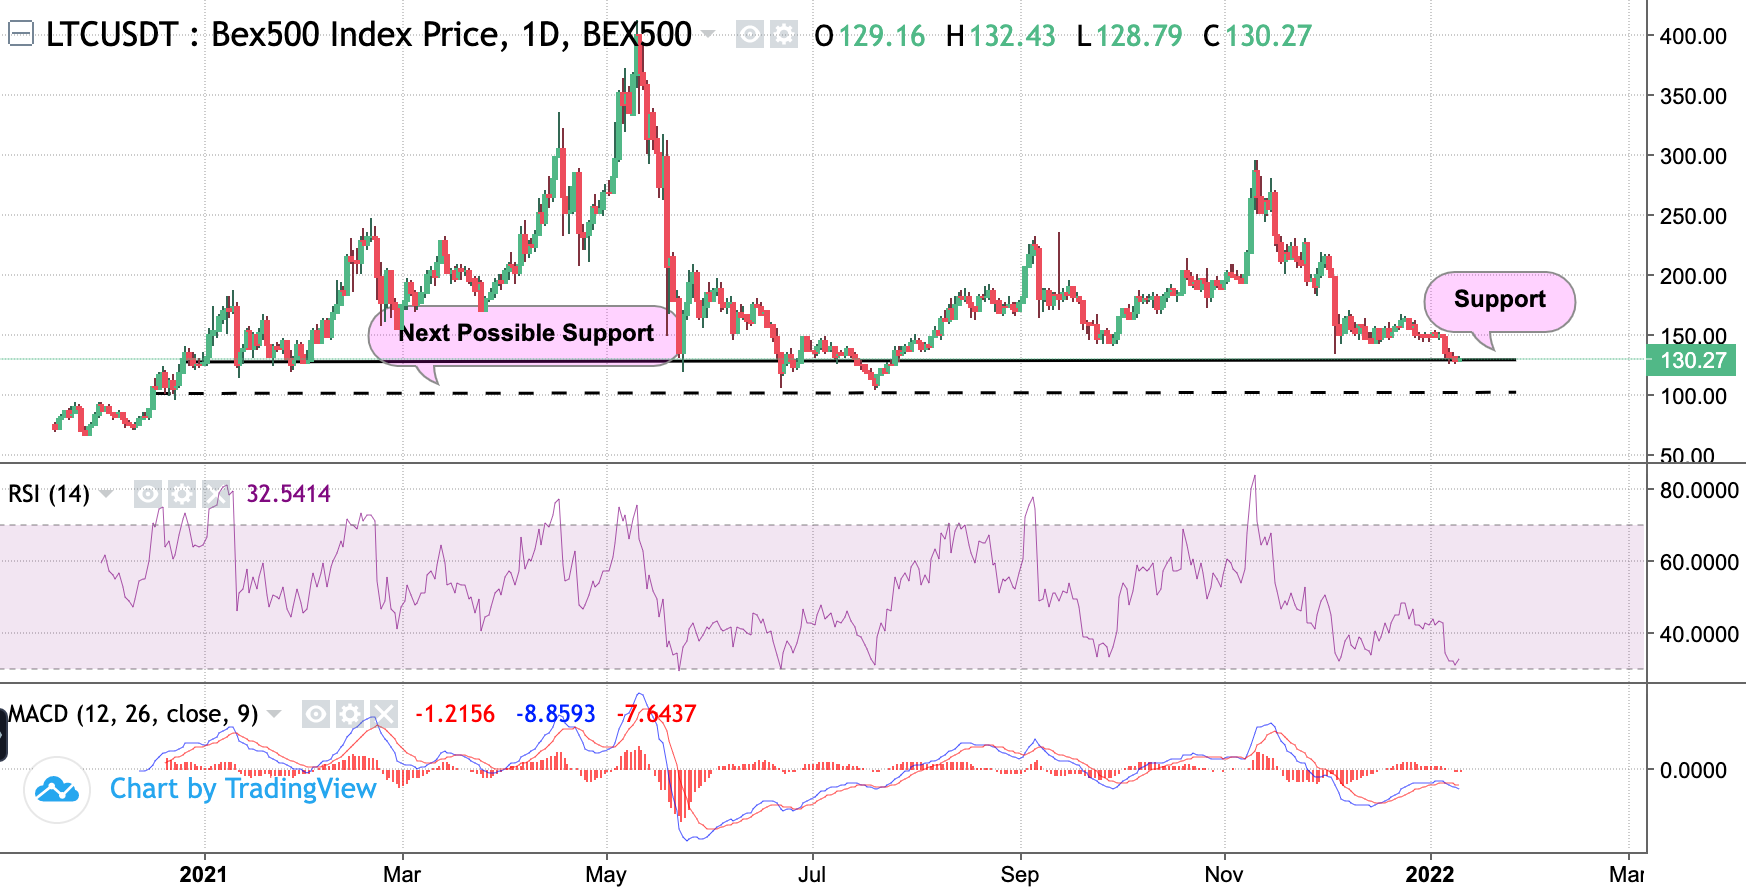
Litecoin is currently changing hands roughly 55% below its last November’s highs – and the crypto is likely to experience a further decline this week.

The daily LTC/USDT price chart shows some worrisome signs. The $130 support that held since July 2021 was broken earlier this week. Additionally, the daily candle’s closing price lies below the support level, which indicates a further price decline is on the horizon. The latest market data suggests that a new LTC/USDT support lies within the $107-$110 range.
Latest Litecoin price predictions, estimated LTC growth and forecast
The moving average convergence divergence (MACD) indicator also forecasts a bearish activity, with the death cross forming on the side of the bears. Generally speaking, MACD is a good market metric that helps traders understand whether the bullish or bearish movement in the price of an asset is strengthening or weakening.
The signal line of the relative strength index (RSI) is on the oversold side of the support line and suggests that bears will retain the upper hand in the near future. For reference, RSI is used to evaluate whether an asset is trading in overbought or oversold conditions.
Technical Analysis: LTC/USDT 4-hour chart
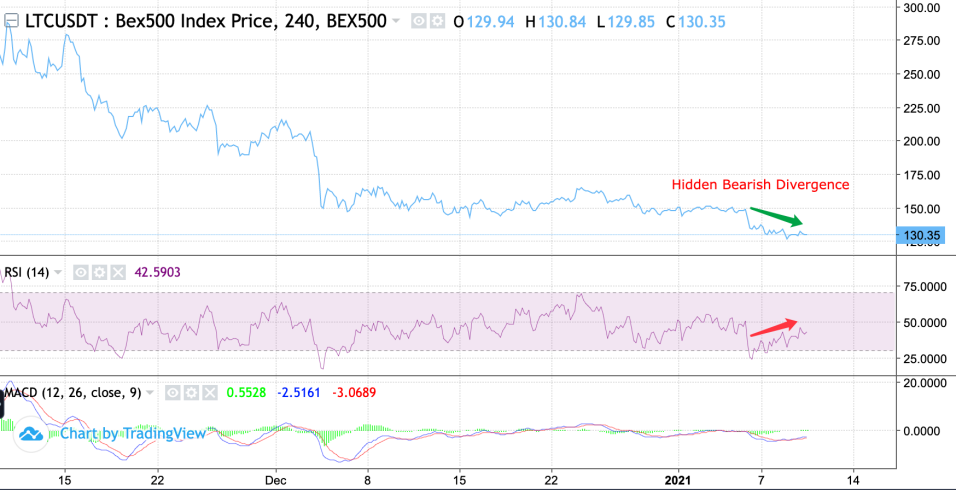
Moving on to the 4-hour chart we can observe similar patterns emerging as in the daily chart.

The MACD indicator has formed a golden cross, while the last chance for the price of Litecoin to remain above the support line was rejected during the last bullish divergence between the price chart and the RSI line. Following the rejection, we can observe a hidden bearish divergence emerging in the correlation between the RSI indicator and the price chart.
Technical analysis of LTC/USDT suggests the market pullback is not yet behind us and that a trend reversal will in all likelihood not come in the coming days. In fact, in the next few days, we could see the price of Litecoin experience an even greater drop than last week.


