Key takeaways:
- ADA might have dropped 5% today but is still up 11% on the week.
- The coin surged into the May high-day closing price at $2.28 and rolled over to break back beneath $2.00.
- Against Bitcoin, Cardano hit June resistance at 4740 SAT and has since dropped to 4400 SAT.
| Cardano price | $1.99 |
| Key ADA resistance levels | $2.00, $2.10, $2.20, $2.28, $2.40, $2.51, $.260, $2.70, $2.78 |
| Key ADA support levels | $1.90, $1.80, $1.75, $1.65, $1.60, $1.50, $1.45 |
ADA fell back beneath $2.00 today after falling by a total of 5%. The cryptocurrency reached the May high-day closing price at around $2.28 on Saturday and has since rolled over from there as it starts to retrace.
ADA is now up almost 70% over the past month, so it is no surprise that the market has started to retrace – allowing the buyers to have a short break before pushing higher again.
With the latest price hikes, it seems that institutional investors are making their first moves into the Cardano blockchain. According to CoinShares, a crypto asset management firm, the Cardano blockchain has seen a total investment reaching $28 million from institutional investors.
The primary fundamental driving force behind the recent ADA growth is the anticipated smart contract launch on the blockchain. The team recently announced that they are targeting September 12th to be the launch date for when smart contracts will go live on Cardano when the Alonzo upgrade finally goes live.
This will usher in a new era for Cardano as projects will finally be able to launch on top of its blockchain – similar to how UNI, AAVE, and COMP are sitting on top of Ethereum.
ADA remains ranked in the 5th position, as it currently holds a $62 billion market cap value. It will be interesting to observe what Cardano coin price prediction for 2022 will be.
Let us take a look at the ADA markets and highlight some areas of support and resistance moving forward.
Cardano Coin Price Analysis

What has been going on?
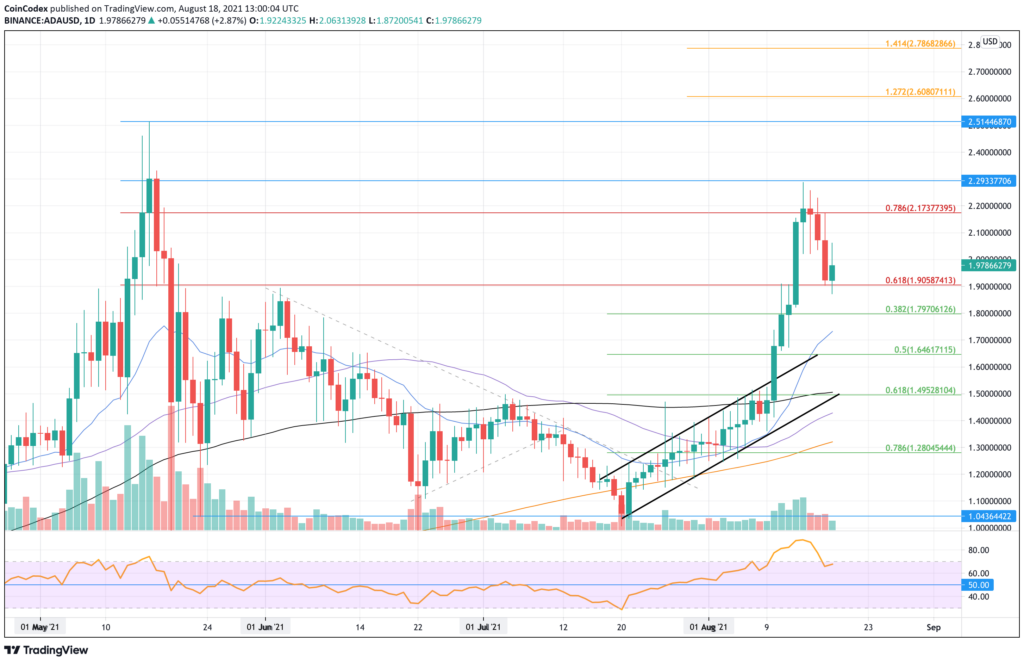
Taking a look at the daily chart above, we can see that ADA rebounded from $1.05 in the final half of July and started to climb higher inside an ascending price channel. Last week, ADA broke toward the upside of the price channel as it started to explode and turn parabolic.
The parabolic move allowed ADA to initially surge into resistance at $1.90, provided by a bearish .618 Fib Retracement level. This resistance was finally penetrated last Friday, which saw ADA climbing further higher to meet resistance at $2.28 on Saturday. The resistance here was the high-day closing price seen in May.
Since hitting this resistance, ADA has rolled over and started to fall. We can see that it is using the previous resistance at $1.90 as support and rebounded higher from there today as it battles to break $2.00 again.
After such a parabolic move higher, it is no surprise that ADA is seeing a retracement. The retracement allows the buyers to take a little break before resetting and pushing the market higher again.
Cardano price short term prediction: BULLISH
The break above $1.50 has now turned ADA bullish in the short term as it pushed above the July highs. To turn neutral, ADA would need to drop beneath the 100-day EMA at $1.50. A break beneath $1.25 (.618 Fib & 200-day EMA) would turn the market bearish in the short term.
Looking ahead, if the sellers push ADA beneath the $1.90 support, further support lies at $1.80 (.382 Fib Retracement), $1.74 (20-day EMA), and $1.65 (.5 Fib Retracement). Additional support is then expected at $1.50 (.618 Fib Retracement & 100-day EMA) and $1.45 (50-day EMA).
Where Is The Resistance Toward The Upside?
On the other side, the first resistance above $2.00 lies at $2.20 (bearish .786 Fib Retracement). This is followed by $2.28 (May high-day closing price), $2.40, and $2.51 (ATH price). Beyond the ATH, additional resistance lies at $2.60 (1.272 Fib Extension), $2.70, and $2.78 (1.414 Fib Extension).
For some alternative analysis, I would recommend looking at this piece.
ADA/BTC price analysis

What has been going on?
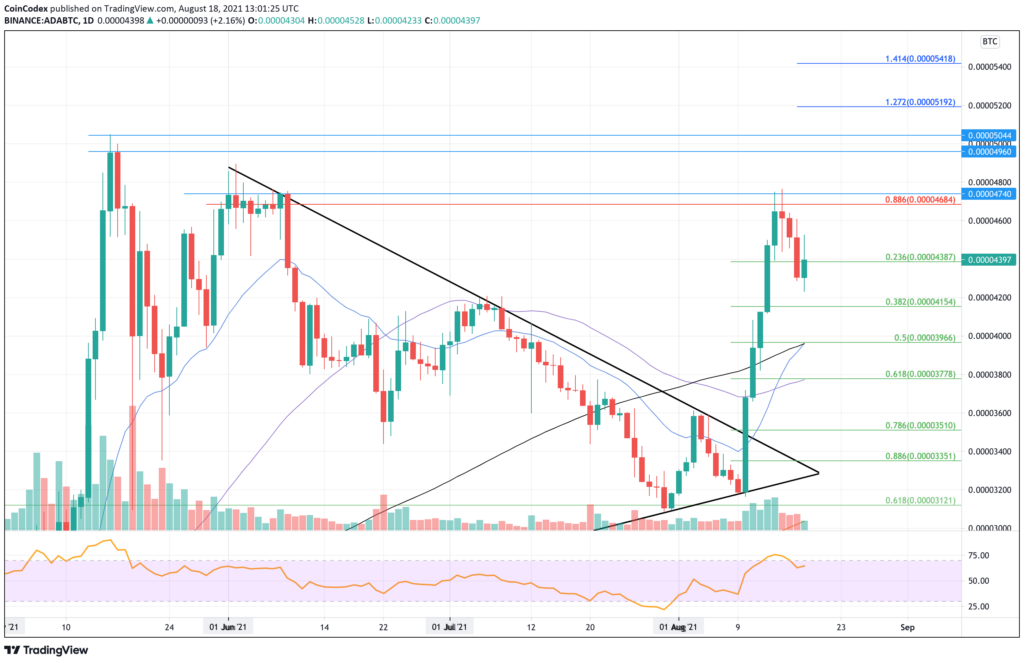
ADA is also performing remarkably well against BTC. Last week, the coin managed to break above a symmetrical triangle pattern as it exploded from 3200 SAT to push higher and hit the June resistance at 4740 SAT over the weekend.
It has since dropped lower from there as it dipped as low as 4230 SAT today. It has rebounded, and the bulls are attempting to regain the support around 4400 SAT, provided by a .236 Fib Retracement level.
ADA/BTC price short term prediction: BULLISH
The break above the July highs at 4200 SAT has allowed ADA to turn bullish in the short term. It would need to drop back beneath 4000 SAT (100-day EMA) to turn neutral again and would have to continue much further beneath the support at 3500 SAT (.786 Fib Retracement) to be in danger of turning bearish.
If the sellers push lower, the first support lies at 4150 SAT (.382 Fib Retracement). This is followed by 4000 SAT (.5 Fib Retracement & 100-day EMA), 3780 SAT (.618 Fib Retracement & 50-day EMA), and $3500 SAT (.786 Fib Retracement).
Where Is The Resistance Toward The Upside?
On the other side, the first resistance lies at 4600 SAT. This is followed by 4740 SAT, 4800 SAT, 4960 SAT, and 5050 SAT (ATH price).
Beyond the ATH price, resistance lies at 5200 SAT (1.272 Fib Extension), 5400 SAT (1.414 Fib Extension), and 5600 SAT.
Keep up-to-date with the latest ADA predictions here.


