Key Highlights:
- Bitcoin has come down slightly from the $18,000 level after it dropped by 1.7% to reach $17,750.
- The cryptocurrency has been on a rampage this past month after it managed to increase by an epic 55%.
- Institutional Investors are still extremely bullish and Citibank expects BTC to hit $300,000 by December 2021.
Support:
$17,522, $17,240, $17,000, $16,820, $16,727, $16,600, $16,500, $16,400, $16,255, $16,000, $15,825, $15,600, $15,400.
Resistance:
$17,833, $18,000, $18,493, $18,789, $19,000, $19,215, $19,647, $19,893, $20,140.
The BTC price increase that we have seen this month has truly been exceptional. The cryptocurrency has managed to surge by a total of 55% over the past 30-days which allowed it to climb above the $18,000 level before dropping off slightly to $17,750;
The cryptocurrency might have dropped around 3.6% from the highs of $18,493 (1.272 Fib Extension) but the market is still looking very strong. There can be no bull run higher without having some inter-rim pullbacks.
Legendary trader, Peter Brandt, put it perfectly when he stated that the 2015 to 2017 bull run had 9 significant price corrections on the way to the previous ATH price. This bull run has only seen two 10% corrections – suggesting that healthy pullbacks will be coming thick and fast for BTC at some point.
However, at the same time, we need to remind ourselves that this epic bull run has been driven by a different set of investors to what caused the previous bull run to the ATH price. The previous bull run (in 2017) was primarily driven by retail investors. These guys were just trying to make a quick buck and were jumping onto the train at any level due to the FOMO they experienced when BTC started to surge.
On the other hand, this bull run has been primarily driven by financial institutions. This is smart money entering the ecosystem. Smart money that isn’t planning to sell anytime soon. The buyers that we see today are very professional and they have a long term vision with deeper pockets than any retail traders so they can easily sit through any downturns with their coins inside cold storage.
It seems that these professional investors are becoming extremely optimistic about where Bitocin might be headed over the next 12 months. Recently, a leaked report from Citibank expects Bitcoin to reach as high as $300,000 by the end of next year – even going as far as calling it 21st-century gold!
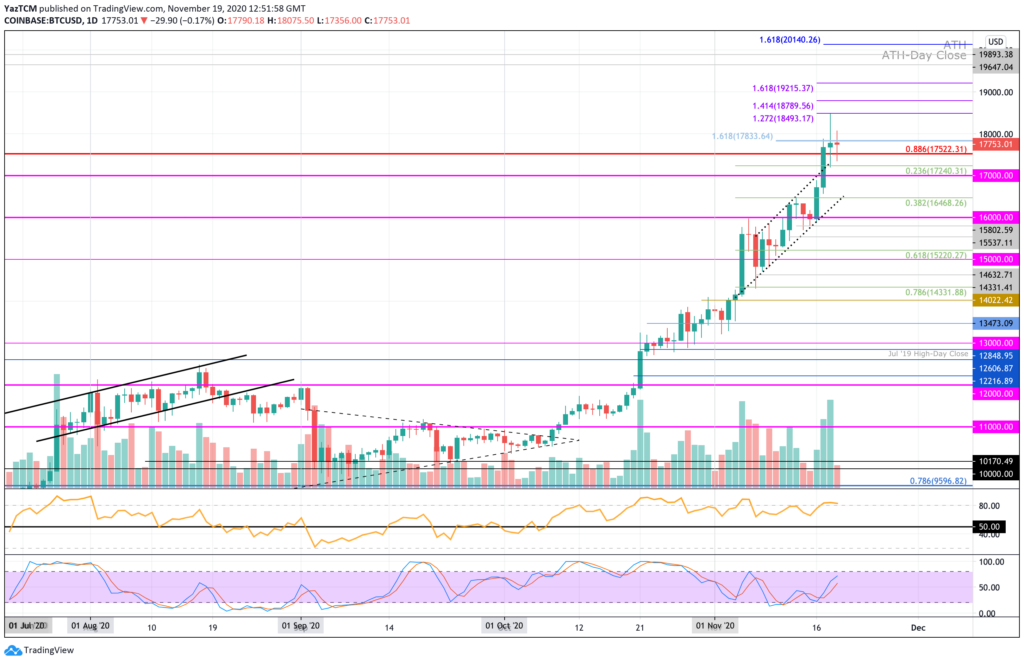
Just taking a look at the daily chart below, you can’t really blame investors as to why they’re so optimistic;

Since the start of September, Bitcoin has managed to surge by a very strong 80%. The majority of this bullish run higher has come from October onward. Recently, the cryptocurrency penetrated the $18,000 to hit the resistance at $18,493 (1.272 Fib Extension). However, the coin seems to be struggling to close a daily candle above the resistance at $17,833 – provided by a 1..618 FIb Extension (blue).
Considering the epic bullish surge we have seen recently, it is unlikely that Bitcoin will be stalled by this resistance for too long at all.
Let us take a closer look at the markets and see where we might be heading.
Bitcoin Price Analysis

What has been going on?
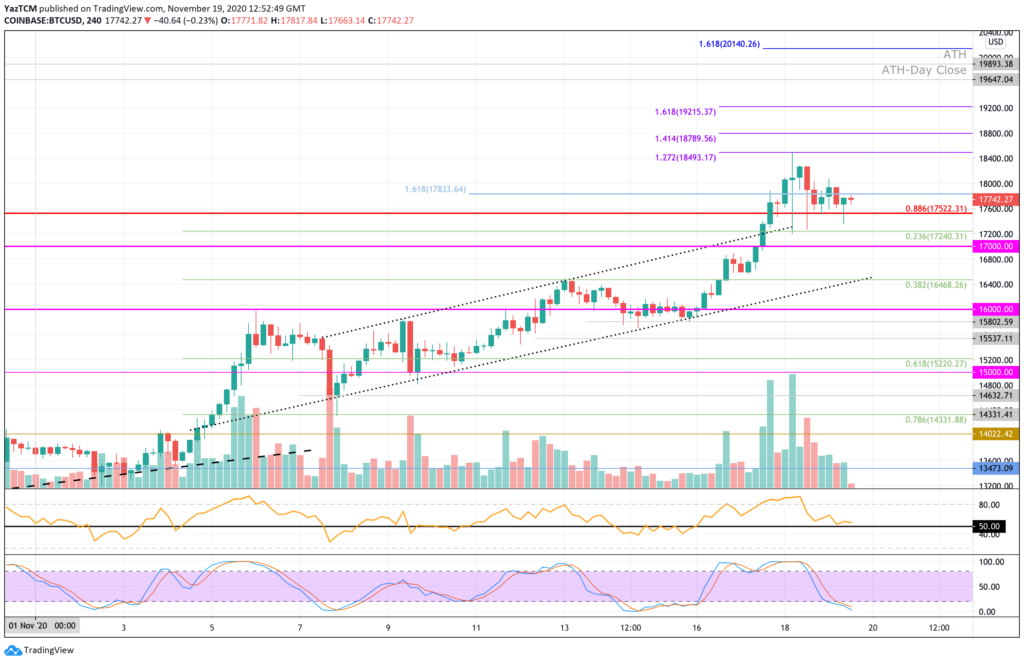
Looking at the 4HR time frame for Bitcoin above, we can see that the cryptocurrency was trading within an ascending price channel for the majority of November. This price channel was penetrated a couple of days ago when BTC managed to climb above the $17,200 level.
After breaking above, BTC went on and continued to climb higher. It met resistance at the $17,833 level (the resistance we are struggling to break on the daily chart) but quickly spiked higher above here. It went on to push above $18,000 to reach as high as $18,493 which is resistance provided by a 1.272 Fib Extension level.
We can see that BTC has dropped lower from this peak as it fell back beneath the $18,000 level. Luckily, the market is still being supported at the $17,600 level so far as it struggles to produce a daily candle close above the $17,833 level.
Bitcoin price short-term prediction: BULLISH
Bitcoin remains strongly bullish right now. The coin would have to fall beneath $16,000 to start to turn neutral and break further beneath $11,000 to be in danger of turning bearish.
IF the sellers push lower, the first level of strong support is expected at $17,240 (.236 Fib Retracement). Beneath this, support lies at $17,000, $16,800, $16,468 (.382 Fib Retracement), and $16,000.
Beneath $16,000, further support can be expected at $15,800, $15,537, $15,220 (.618 Fib Retracement), and $15,000.
Where Is The Resistance Toward The Upside?
On the other side, the first level of resistance to break lies at $17,833. Above this, resistance can be expected at $18,000, $18,200, and $18,493 (1.272 Fib Extension level). If the buyers continue to break the resistance at $18,500, additional resistance can be found at $18,789 (1.414 Fib Extension), $19,000, and $19,215 (1.618 Fib Extension).
If the bulls penetrate the resistance at $19,215, resistance is found at $19,500, $19,647 (ATH Daily close), $19,893 (previous ATH), $20,000, and $20,140.


