
Key takeaways:
- TWT is up by a strong 16.5% today as the cryptocurrency makes its way back toward the June highs
- TWT is up by a further 55% over the past month
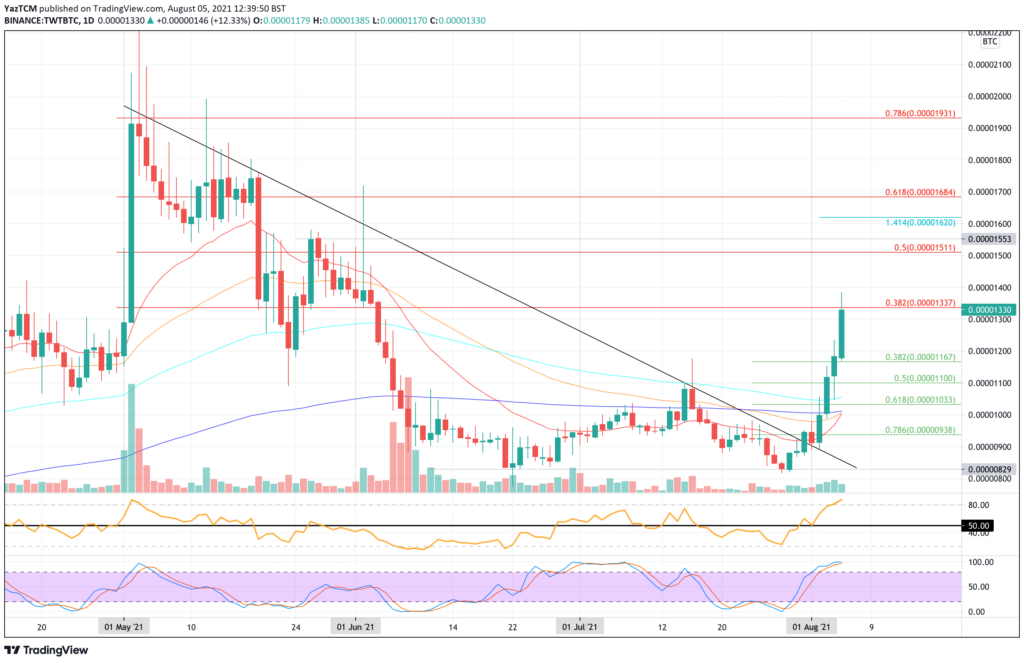
- Against BTC, TWT surged beyond the 100-day EMA this week to hit resistance at 1330 SAT (bearish .382 Fib Retracement)
| Trust Wallet Token price | $0.496 |
| Key TWT resistance levels | $0.55, $0.60, $0.622, $0.645, $0.7, $0.721, $0.77, $0.85, $0.9, $1.00 |
| Key TWT support levels | $0.5, $0.45, $0.434, $0.4, $0.366, $0.35, $0.318, $0.3 |
Trust Wallet Token (TWT) has been on a rampage over the past month as it surges by a whopping 55% to reach as high as $0.55 today. The cryptocurrency rebounded from support at $0.26 earlier in July and began a bullish leg higher, allowing it to take out of the July highs and climb beyond the 100-day EMA level.
Launched in October 2020, TWT is a BEP-20 asset on the Binance Smart Chain. The token provides utility for users of the Trust Wallet application, allowing users to store multiple cryptocurrencies securely on their mobile devices.
The wallet itself was founded in 2017 by Viktor Radchenko. Holders of the token can vote on governance proposals within the wallet itself, allowing them to have a say in the future direction for the wallet. Additionally, the TWT token also discounts the decentralized exchange service when making swaps between crypto within the app.
TWT is now ranked in the 274th position on the crypto market as it currently holds a $125 million market cap value. You can find commonly used technical indicators on our Trust Token Wallet price prediction page. Read further to find out more about Trust Wallet price forecasts.
Trust Wallet Token price analysis
What has been going on?
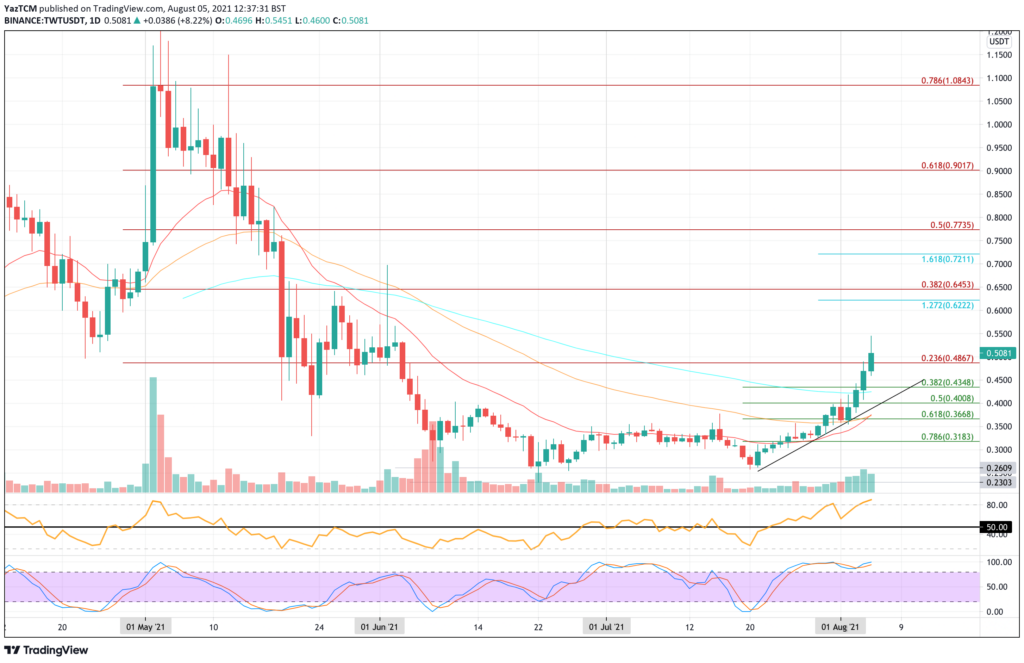
Taking a look at the daily chart for TWT, we can see that the token managed to reach as high as $1.31 during the May market boom. However, TWT plummeted during the subsequent mid-May market collapse, in which the token fell as low as $0.4.
During June, TWT would go on to continue further as it dropped beneath $0.4 and went on to create a new cycle low at around $0.23. More specifically, the low-day closing price was around $0.26, and TWT went on to rebound higher from there.
In July, TWT spent the first half of the month in a battle with the 20-day EMA level at around $0.35. It was unable to overcome this resistance in the first half of the month and ended up dropping into the June low-day closing price at $0.26 on the 20th of July.
Luckily, TWT would go on to rebound higher from $0.26 and begin to establish a bullish leg higher. By the end of July, TWT managed to create a fresh high for the month as it hit $0.4.
In the first week of August, TWT bounced from the 50-day EMA at $0.36 and would go on to clear resistance at $0.45 provided by the 100-day EMA on August 4th.
Today, August 5th, TWT surged higher to break resistance at $0.486 (bearish .236 Fib Retracement) and climb back above $0.5 for the first time since early June.
TWT price short term prediction: Neutral
TWT is still considered neutral until it can break the resistance at the June highs, currently set at around $0.7. On the other side, TWT would have to drop beneath the rising trend line and fall beneath $0.3 before being in danger of turning bearish in the short term.
If the sellers push lower, the first support lies at $0.5. This is followed by $0.43 (.382 Fib Retracement), $0.4 (.5 Fib Retracement), the rising trend line, and $0.366 (.618 Fib Retracement).
Trust Wallet Token Price Forecasts
On the other side, if TWT can continue to climb off of the recently established momentum, the first resistance is expected at $0.622, provided by a 1.272 Fib Extension level. Above this, resistance lies at $0.645 (bearish .382 Fib Retracement) and $0.7 – the June highs.
Once above $0.7, TWT will clearly be bullish and should continue much higher from there. In this case, resistance would lie at $0.77 (bearish .5 Fib Retracement), $0.8, $0.85, and $0.9 (bearish .618 Fib Retracement).
TWT/BTC price analysis
What has been going on?
TWT is performing very well against BTC itself. The cryptocurrency rebounded from support at 830 SAT at the end of July and would break a long-term descending trend line from there.
In August, TWT bounced from 900 SAT to break beyond 1000 SAT and climbed above the 200-day EMA. Since breaking the 200-day EMA, TWT soared beyond 1200 SAT today to reach the resistance at 1340 SAT, provided by a bearish .382 Fib Retracement.
TWT price short term prediction: Neutral
TWT is still neutral until it can clear June resistance at around 1500 SAT. On the other side, a drop back beneath 1000 SAT would now put TWT in danger of turning bearish in the short term.
If the sellers push lower, the first support lies at 1167 SAT (.382 Fib Retracement). This is followed by 1100 SAT (.5 Fib Retracement), $1050 SAT (100-day EMA), 1000 SAT (200-day EMA), and 940 SAT (.786 Fib Retracement).
Trust Wallet Token Price Forecasts
On the other side, once TWT clears 1340 SAT, the first solid resistance lies at 1500 SAT, provided by a bearish .5 Fib Retracement level. Above this, resistance lies at 1550 SAT, 1620 SAT (1.414 Fib Extension), 1685 SAT (bearish .618 Fib Retracement), 1800 SAT, and 1930 SAT (bearish .786 Fib Retracement).