Across the major cryptocurrency, spectrum coins have been facing headwinds. While bitcoin was down a robust 6% in August, it paled to the declines seen in Ethereum and Litecoin. Negative momentum continues to perpetuate, for cryptocurrency trading in India, while a few of the major coins are technically oversold.
Bitcoin
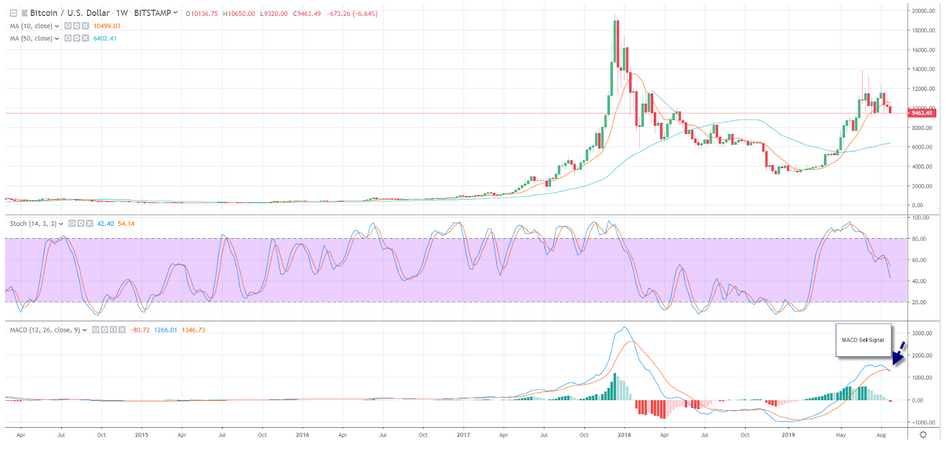
Bitcoin is the largest and the most liquid of the cryptocurrencies. Bitcoin has traded lower throughout August and is down slightly more than 6%. The exchange rate is currently testing support levels near the late July lows at 9,049. A break through this level would lead to a test of the 50-week moving average at 6,402. Short term resistance for Bitcoin is seen near the 10-week moving average at 10,499.
Short term momentum on bitcoin has turned negative as the fast stochastic recently generated a crossover sell signal. The fast stochastic is printing a reading of 42, which is in the middle of the neutral range.
Medium-term momentum has also turned negative as the MACD (moving average convergence divergence) index recently generated a crossover sell signal. This occurs as the MACD line (the 12-week moving average minus the 26-week moving average) crosses below the MACD signal line (the 9-week moving average of the MACD line). The MACD histogram is printing in the red with a downward sloping trajectory which points to a lower exchange rate for bitcoin.
Ethereum
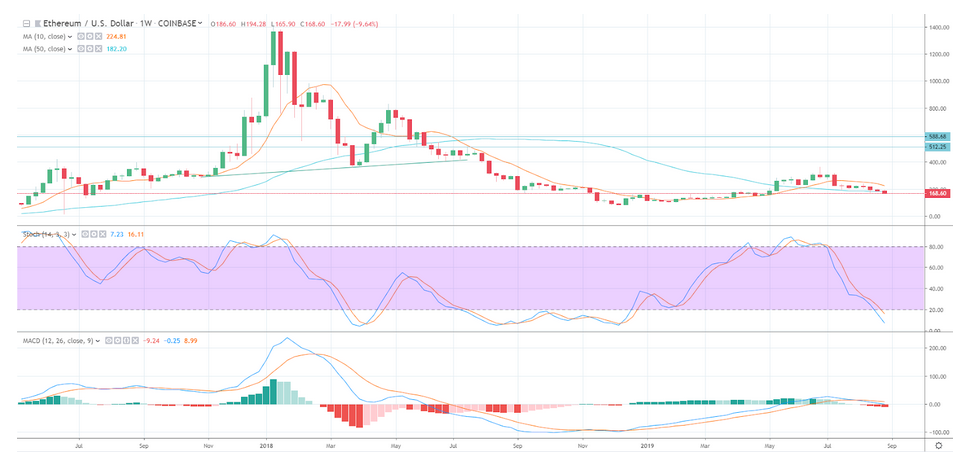
Ethereum was hammered in August dropping nearly 23% for the month. Prices have experienced a steady decline but are now oversold. The current reading on the fast stochastic, is 7, well below the oversold trigger level of 20 which could foreshadow a correction. The relative strength index (RSI) which is a momentum oscillator that measures overbought and oversold levels is printing a reading of 29, on a daily basis, below the oversold trigger level of 30 which also could foreshadow a correction. Medium-term momentum has also turned negative as the MACD (moving average convergence divergence) index recently generated a crossover sell signal. This occurs as the MACD line (the 12-week moving average minus the 26-week moving average) crosses below the MACD signal line (the 9-week moving average of the MACD line). The MACD histogram is printing in the red with a downward sloping trajectory which points to a lower exchange rate for Ethereum.
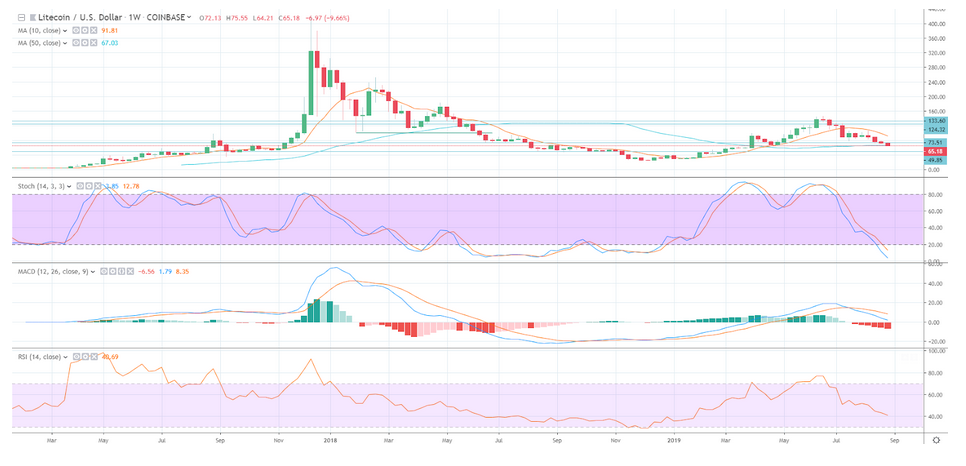
Litecoin
Litecoin is down a whopping 34% for August and continues to trade under pressure. Support is seen near the December 2018 lows at 22. Resistance is seen near the 10-week moving average at 91.81. Medium-term momentum has also turned negative as the MACD (moving average convergence divergence) index recently generated a crossover sell signal. This occurs as the MACD line (the 12-week moving average minus the 26-week moving average) crosses below the MACD signal line (the 9-week moving average of the MACD line). The MACD histogram is printing in the red with a downward sloping trajectory which points to a lower exchange rate.