We are at Week 48 and we recently released the top 4 coins to watch this week. The coins involved are BTC, ETH, XLM, and ZEN;

To find out these projects in a little more detail and why we chose them, take a look at the article here.
In this analysis, I would like to cover these four coins to help provide some areas of support and resistance you might expect moving forward.
Bitcoin (BTC) Price Analysis
What has been going on?
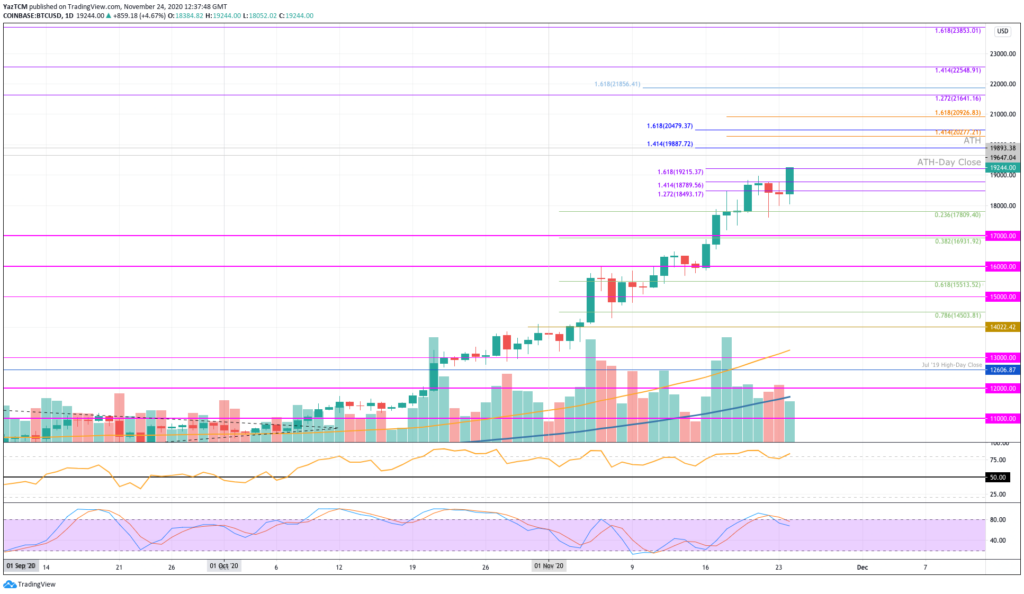
Bitcoin has been on an absolute rampage this month as it managed to increase by a strong 48% to climb above $19,000 today. The cryptocurrency is now just sitting a small 4% from the previous all-time high (ATH) price of $19,893 (Coinbase price).
Looking at the chart above, we can see that BTC managed to break above a symmetrical triangle at the start of October which was the first signal of the bullish trend. It went on to break above $11,000 to reach as high as $14,000 by the end of October.
The mega price surge occurred during November. The cryptocurrency started to climb as it hit $16,000 in the first week of the month. The coin continued higher after mid-November as it started to drive higher toward the $18,000 level.
Last week, the cryptocurrency hit the resistance at $18,790 (1.414 Fib Extension level). It was unable to break this resistance until today when BTC climbed higher to reach the $19,215 resistance at the 1.618 Fib Extension level.
BTC price short term prediction: Bullish
Bitcoin is strongly bullish right now. The coin would need to drop beneath $15,600 to turn neutral and further beneath $13,000 to be in danger of turning bearish.
If the sellers push lower, support lies at $19,000, $18,790, $18,500, and $17,800 (.236 Fib). Added support lies at $17,000.
Where is the resistance toward the upside?
On the other side, once the buyers break $19,215, the first level of resistance lies at $19,647 (ATH-day closing price). This is followed by resistance at the ATH price of $19,893 and then $20,000.
Beyond $20,000, resistance lies at $20,277, $20,500, $20,926, $21,000, and $21,641.
Stellar (XLM) Price Analysis
What has been going on?
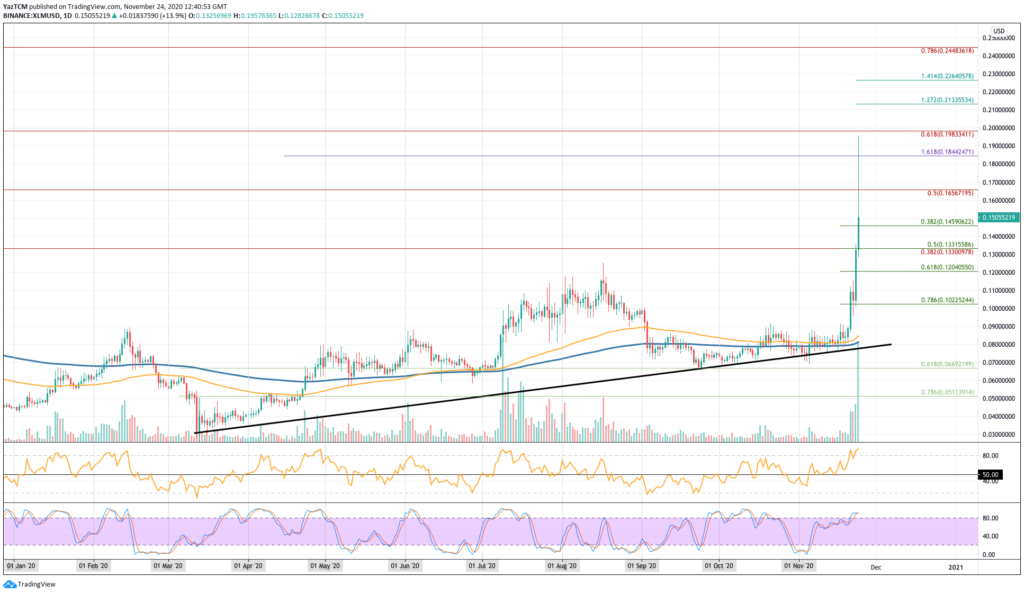
XLM has seen a mega 80% price surge over the last week of trading as the coin managed to reach as high as $0.195. It has since dropped slightly to trade at the $0.15 level. The cryptocurrency started to surge this week on the back of the XRP price explosion which saw it increasing by over 100%. As you may know, XLM is a fork of XRP so they follow each other’s price movements the majority of the time.
XLM price short term prediction: Bullish
XLM is also considered as bullish right now. The coin would need to fall beneath $0.12 to turn neutral and further beneath $0.08 to turn bearish.
If the sellers push lower, the first level of support lies at $0.14. Beneath this, support is located at $0.133 (.5 Fib), $0.12 (.618 Fib), $0.11, and $0.10 (.786 FIb).
Where is the resistance toward the upside?
On the other side, if the buyers push higher, the first level of resistance lies at $0.165 (bearish .5 Fib). Above this, resistance lies at $0.17, $0.18, $0.184 (1.618 Fib Extension), and $0.198 (bearish .618 Fib).
Additional resistance is expected at $0.21, $0.213, $0.226, and $0.244 (bearish .786 Fib Retracement).
Horizen (ZEN) Price Analysis
What has been going on?
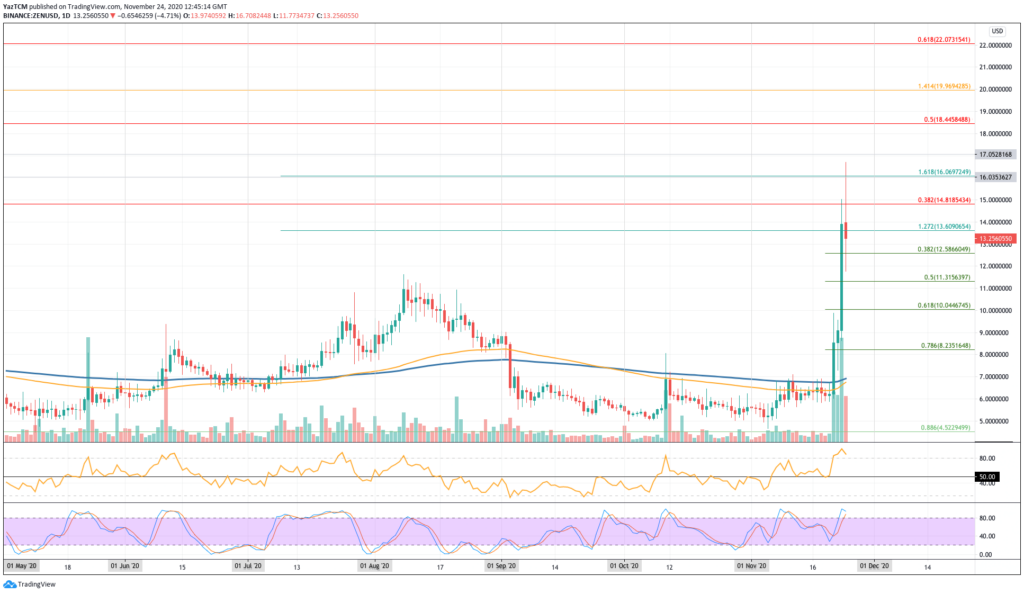
ZEN managed to climb by a total of 107% this week to reach as high as $16.50. The coin has dropped slightly as it trades at the $13.35 level. The coin was trading beneath the $6.00 level a few days ago when it managed to surge higher to break the 200-days EMA. From there, it continued to push higher to reach the $14.81 resistance yesterday – provided by a bearish .382 Fib Retracement.
The spike toward $16.50 allowed it to reach a fresh 2-year high price as it hit a level that had not been seen since November 2018.
ZEN price short term prediction: Bullish
ZEN is also strongly bullish right now. The coin would need to drop beneath $11.30 to turn neutral and it would have to fall beneath $8.00 before being in danger of turning bearish.
If the sellers push lower, the first level of support lies at $12.58 (.382 Fib). Beneath this, support lies at $12, $11.31 (.5 Fib), $10 (.618 Fib), $9, and $8.23 (.786 Fib).
Where is the resistance toward the upside?
On the other side, the first level of resistance is expected at $14. Above this, resistance lies at $14.81 (bearish .382 Fib), $16 (1.618 Fib Extension), $17.05, and $18.44 (bearish .5 Fib Retracement).
Ethereum (ETH) Price Analysis
What has been going on?
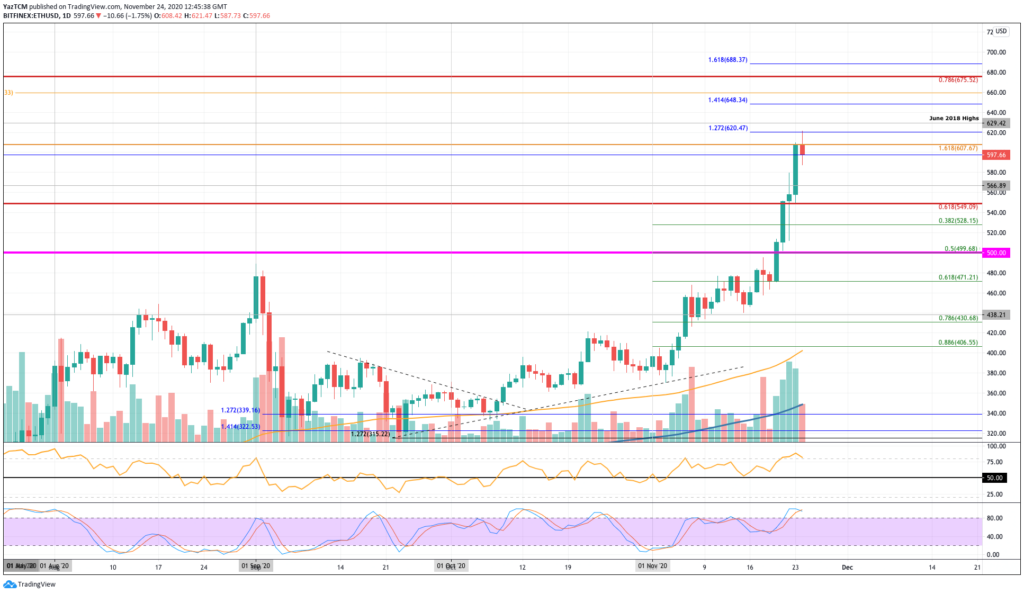
Etheruem managed to outperform Bitcoin this week as it surged by a total of 28.6% to reach the current $600 level. The cryptocurrency had jumped higher from $550 yesterday as it surged above $600 to close the day at $607. Today, Ethereum managed to poke slightly higher to hit $620 (1.272 Fib Extension) but has since dropped back into the $600 support.
ETH price short term prediction: Bullish
Ethereum is also considered as strongly bullish right now. The coin would need to fall beneath $475 to turn neutral and it would have to drop beneath $320 to be in danger of turning bearish.
If the sellers do push beneath $600, the first level of support lies at $580. Beneath this, support lies at $566, $550, $528 (.382 Fib), and $500 (.5 Fib). Added support lies at $471 (.618 Fib), $560, and $438.
Where is the resistance toward the upside?
On the other side, if the buyers push higher and break the $607.67 resistance, the first level of higher resistance lies at $620.50 (1.272 Fib Extension). Above this, resistance lies at $630 (June 2018 Highs), $640, $648 (1.414 Fib Extension), and $660.
Following this, added resistance is found at $675 (bearish .786 Fib), $688 (1.618 Fib Extension), and $700.