Key Highlights
- Bitcoin dropped by a sharp 3% over the past 24 hours of trading as the coin drops beneath $12,000 to reach $11,835.
- Despite the recent price drop, the downside is limited to the lower boundary of the current ascending price channel.
- Interestingly, flood warnings in China caused the Bitcoin Hashrate to drop yesterday.
Bitcoin fell by a sharp 3% over the past 24 hours of trading as the coin rolled over from $12,400 to break beneath $12,000 as it reaches $11,800. Prior to this, Bitcoin had jumped above the resistance at $12,000 to reach as high as $12,471 (1.414 Fib Extension level). This resistance is further bolstered by the upper boundary of a short term rising price channel.
It was unable to overcome this resistance, which led to Bitcoin rolling over and falling today.
Interestingly, the Bitcoin hash rate dropped by around 10-15 exahashes over the past 24 hours;

The hash rate is provided by the miners who provide computational resources to unlock Bitcoin blocks, facilitate Bitcoin transactions, and release new BTC into circulation. The hash rate offers security to the Bitcoin network, and any substantial fall in the hash rate is likely to cause widespread panic in the Bitcoin community.
From the chart above, we can see that the EH/s level dropped from 140.7 EH/s to beneath 108 EH/s – quite a significant drop. As it turns out, this is primarily due to the problem of mining centralization in China. Reports have estimated that over two-thirds of the entire Bitcoin mining power comes from China – concentrated in rural areas where the electricity is exceptionally cheap.
The cost of mining is substantial, and the costs can be reduced if electricity prices are lower. This is why we see a large proportion of the mining for Bitcoin in China. Although this has been an issue since the early days of Bitcoin, it has never really caused a problem as Chinese miners conduct their operations for profit, making them extremely reliable.
However, the recent drop in hash rate is mostly a result of mining centralization in China. Yesterday, there was a weather warning due to heavy rain, which caused power stations in rural areas to cut off their power to avoid the risk of flooding. This caused the EH/s to drop aggressively – resulting in Bitcoin rolling over and falling beneath $12,000.
Despite the recent price drop, the market still remains in a bullish trading channel.
Quickly taking a look at the order books, we can see that there is quite some buy support leading to $11,700. However, on the same token, there is strong resistance to overcome before we reach $12,000.

Bitcoin Price Analysis

What has been going on?
Taking a look at the daily chart above, we can see that Bitcoin had rolled over from the resistance at the upper boundary of the price channel on Monday. Yesterday, the coin dropped lower from this level as it broke beneath $12,000, and the price fall continued today as it reached support at the lower boundary of the channel.
Let us take a look at the 4HR chart for a clearer perspective of what is going on;
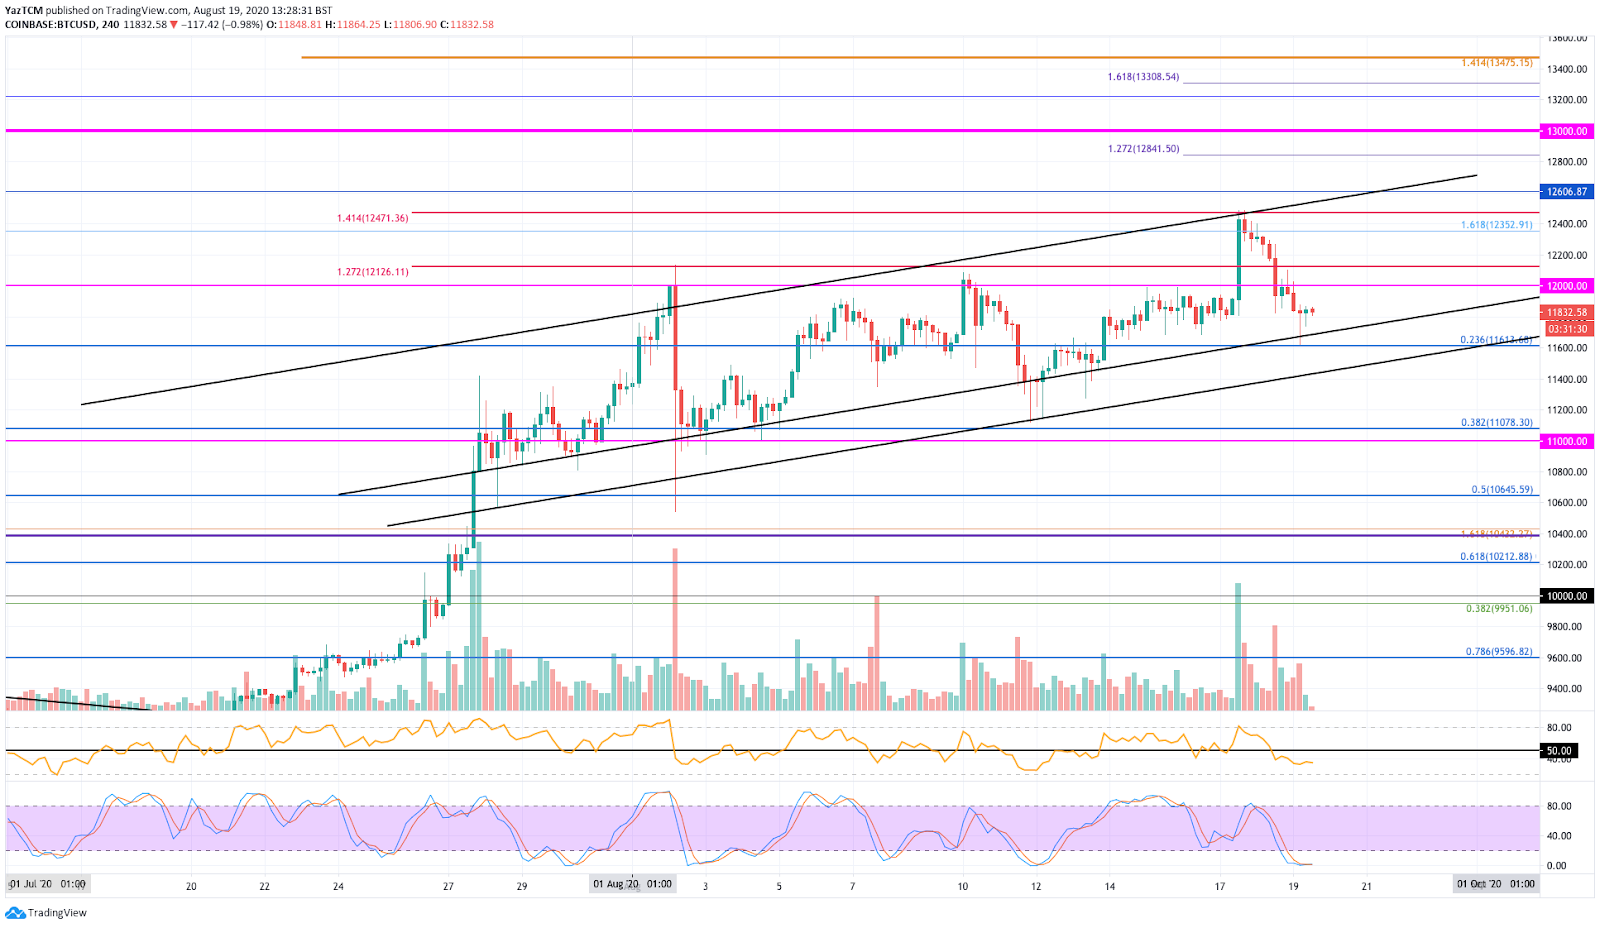
What has been going on?
Looking at the 4-hour chart above, we can see how Bitcoin failed to overcome the resistance at the upper boundary of the channel – which is the 1.414 Fib Extension resistance. It rolled over to drop beneath $12,000 and reached the support at the .236 Fib Retracement at $11,600.
The buyers are defending this level aggressively to keep the market within the trading channel.
You may notice that there is another parallel line beneath the trading channel. This is a duplicate of the same slope at a lower level. You can see that Bitcoin has spiked into this duplicate slope several times during August 2020. If we break beneath the lower boundary, then this duplicate should act as the final boundary of support. If this second slope is broken, Bitcoin is likely to head back beneath $11,000.
Bitcoin price short-term prediction: BULLISH
Bitcoin still remains bullish if we stay in the confines of this price channel. A drop beneath the duplicate boundary would cause BTC to turn neutral, and a further collapse beneath $10,645 would put Bitcoin in danger of becoming bearish again.
If the sellers do push lower, the original lower boundary of the price channel should provide the first level of support. This is followed by added support at $11,613 (.236 Fib Retracement) and then the duplicated slope.
If we break beneath this duplicated slope, support lies at $11,400, $11,080 (.382 Fib Retracement), and $11,000.
Beneath $11,000, support is then found at $10,645 (.5 Fib Retracement), $10,400, and $10,200 (.618 Fib Retracement).
Where Is The Resistance Toward The Upside?
On the other side, if the bulls can regroup and push BTC back above $12,000, resistance lies at $12,126 (1.272 Fib Extension), $12,352, and $12,471 (1.414 Fib Extension & upper boundary of the channel).
If the bulls can push above the upper boundary of the price channel, resistance lies at $12,600, $12,841 (1.272 Fib Extension), and $13,000.
What Are The Technical Indicators Showing?
The RSI has dropped well beneath the 50-line on the 4HR chart to indicate that the sellers are in charge of the market momentum. Luckily, the 4HR Stochastic RSI is in oversold conditions and is primed for a bullish crossover signal, which should send the market higher.
Bitcoin forecast.
Not much has changed since the forecast from yesterday. Remember the two options I provided?;
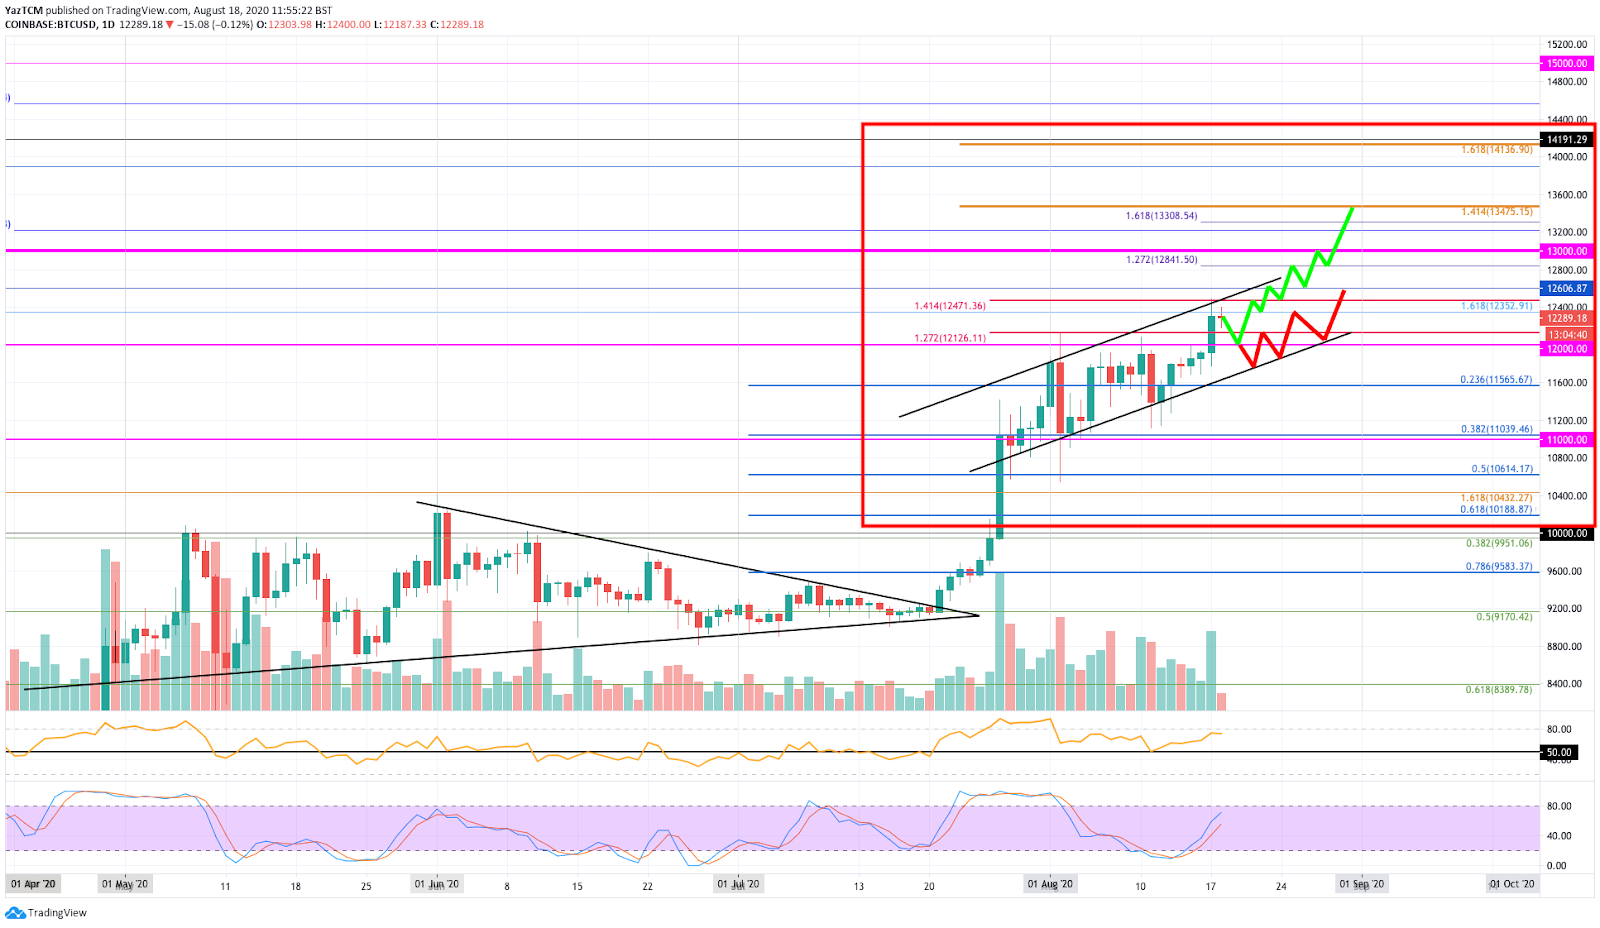
Well, it seems that we are following the slower price increase in the channel. So long as we can remain in this price channel, we do not have too much to worry about in the short term. A break beneath $11,000, on the other hand, would be quite disastrous for Bitcoin in the short term.