Key Highlights
- Bitcoin saw a 5.56% price surge over the past week which allowed it to break $16,000 and reach $16,315.
- Ethereum saw a stronger 6.34% price increase this week as the coin hits the $466.83 level.
- XRP pretty much moved sideways this week as it climbed by a small 0.7%.
Bitcoin has been on an absolute rampage this month as the cryptocurrency managed to increase by a strong 42.6% to break $16,000. Although this is positive news for the industry, it is still yet to seep into altcoin. Over the past month, Ethereum has surged by 23.4% but XRP has barely moved as it climbed by a tiny 1.34% in comparison.

Let us take a look at the top 3 coins and provide some areas of strong support and resistance moving forward.
Bitcoin Price Analysis
What has been going on?
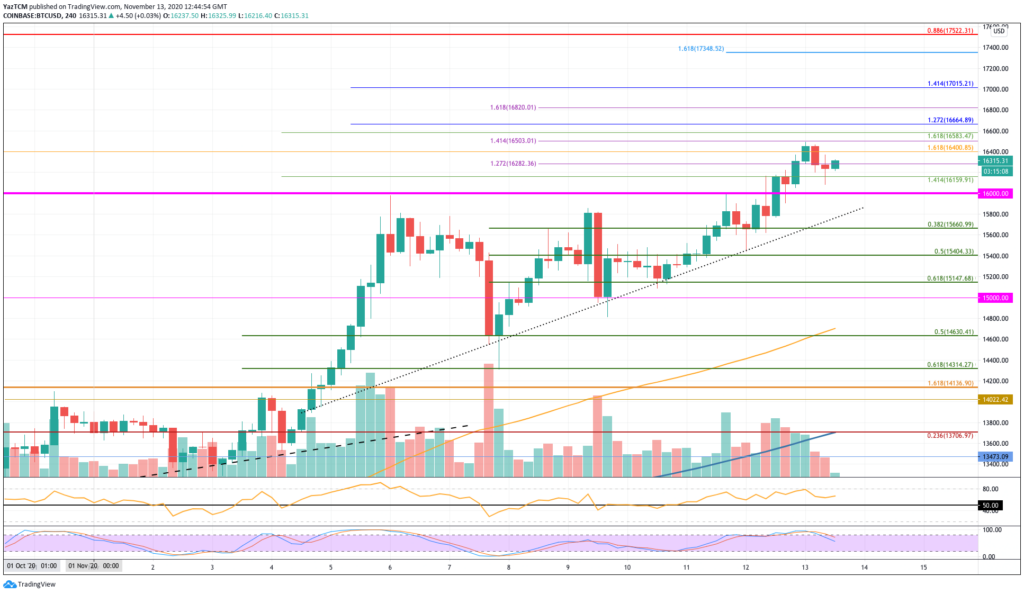
Taking a look at the 4HR chart above, which shows the entire November trading period, we can see that the coin started to break higher once it penetrated above $14,000 at the start of the month. On the first push higher, Bitcoin managed to climb to almost touching the $16,000 level. It was unable to sustain this high which caused the coin to head lower on the 7th of November to crash into the support at $14,630 (.5 Fib).
It rebounded from this support and started to slowly grind higher again as it traded above a rising trend line. This week, Bitcoin managed to touch the $16,000 level and eventually went on to break above the resistance. After breaking above, we can see that Bitcoin continued higher today to reach as high as $16,503 (1.414 Fib Extension).
It has since dropped slightly lower from this resistance to trade at $16,315.
BTC price short term prediction: BULLISH
BTC is most certainly bullish right now. The coin would need to drop beneath $14,600 to be in danger of turning neutral. It is a long way away from turning bearish and would need to drop beneath $11,000 to do so.
If the sellers push lower, the first level of support lies at $16,160. Beneath this, support lies at $16,000, $15,800 (rising trend line), $15,660 (.382 Fib Retracement), $15,400 (.5 Fib Retracement), $15,150 (.618 Fib Retracement), and $15,000.
Where is the resistance toward the upside?
On the other side, the first level of resistance is expected at $16,500 (1.414 Fib Extension – purple). Above this, resistance lies at $16,583, $16,664, $16,820, and $17,000.
Beyond $17,000, resistance lies at $17,200, $17,350, and $17,522.
Ethereum Price Analysis
What has been going on?
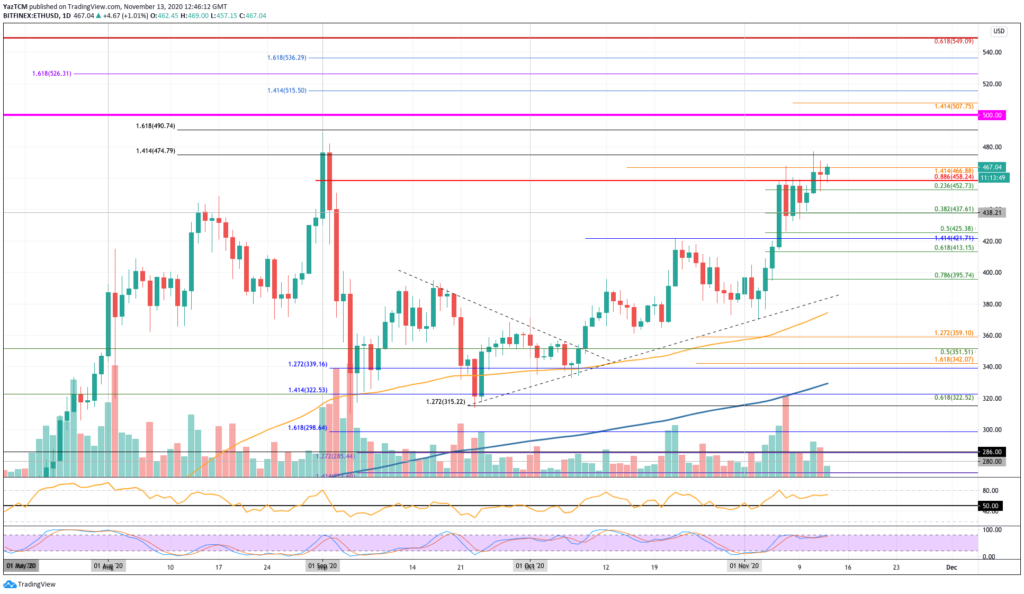
Ethereum has also seen strong growth since it rebounded from the support at the rising trend line around $380 earlier in November. The cryptocurrency quickly went on to break the October highs at $421 as it climbed into the resistance at $458 (bearish .886 Fib Retracement).
It struggled to break this resistance for a few days but eventually penetrated above it on Wednesday when the coin spiked as high as $475. We can see that the coin is now battling to break the resistance at $467 and must close above this if we would like to see it climbing higher.
ETH price short term prediction: BULLISH
Ethereum is considered bullish in the short term. The coin would need to drop beneath $400 to turn neutral again and it would have to fall further beneath $315 before being in danger of turning bearish.
If the sellers push lower, the first level of support lies at $458. This is closely followed by support at $452 (.236 Fib), $437 (.382 Fib), and $425 (.5 Fib). If the sellers continue beneath the October highs at $421, support lies at $413.15 (.618 Fib), $400, and then at the rising trend line.
Where is the resistance toward the upside?
On the other side, if the buyers break $467, the first level of resistance is located at $475 (September high-day close). Above this, resistance lies at $490 (1.618 Fib Extension), $500, and $507.
Additional resistance is then located at $515, %526, %536, and $550 (bearish .618 Fib Retracement).
Ripple Price Analysis
What has been going on?
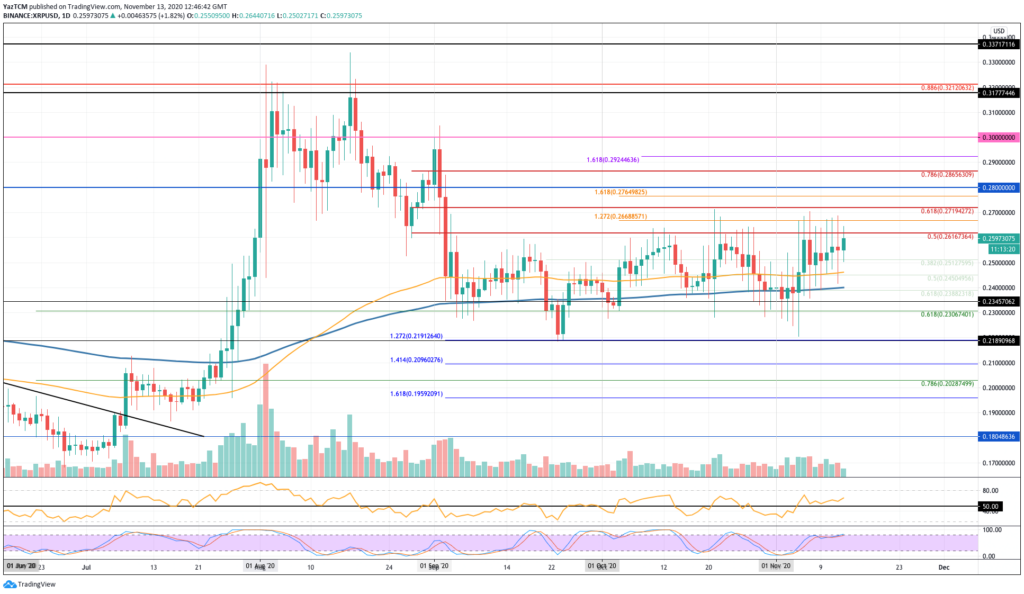
Ripple is in a totally different situation from Bitcoin and Ethereum. For the past 2-months, the market has been extremely choppy for XRP as it trades within a range between $0.261 and $0.23 for the period. The coin has attempted to break the upper boundary of this range multiple times but keeps becoming stuck at the $0.261 resistance – provided by a bearish .5 Fib Retracement level.
We would need to see a breakout of this range to dictate the next direction for XRP.
XRP price short term prediction: NEUTRAL
As we are trading within a range, XRP has to be considered as neutral right now. It would need to break above $0.266 to turn bullish and break beneath the $0.23 support to turn bearish.
If the sellers push lower, support is found at $0.251, $0.245 (100-days EMA), $0.238 (200-days EMA), $0.234, and $0.23 (.618 Fib Retracement).
Where is the resistance toward the upside?
On the other side, the first level of resistance lies at $0.261 (bearish .5 Fib Retracement). Above this, resistance lies at $0.266, $0.271 (bearish .618 Fib Retracement), $0.276, and $0.28. Additional resistance then lies at $0.286 (bearish .786 Fib Retracement), $0.292, and $0.3.