Key Highlights
- Bitcoin dropped by 5.57% this week as the coin reached $11,500.
- Ethereum saw a 8.8% price decline this week as it reached $390 today.
- XRP dropped by 9% over the past week as it reached the $0.28 level.
BITCOIN PRICE ANALYSIS
What has been going on?
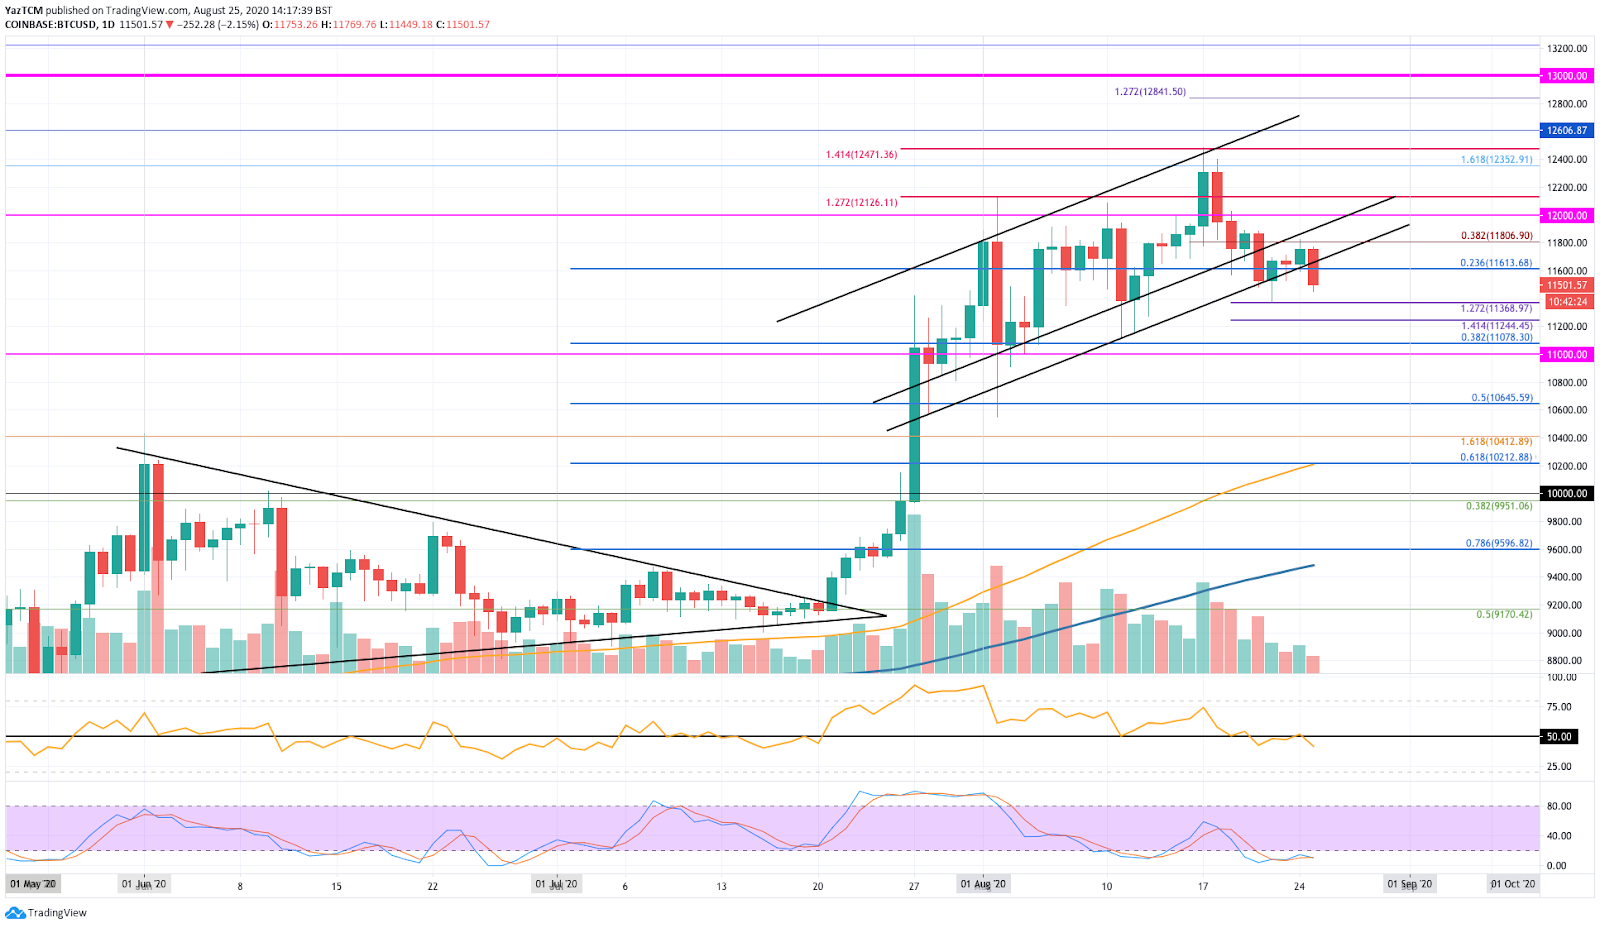
Taking a look at the daily chart above, we can see that Bitcoin had penetrated above a symmetrical triangle toward the end of July as it surged above the $9,200 level. The coin continued higher to reach the $11,800 level in August.
As August progressed, we can see that Bitcoin was trading within a rising price channel. The coin continued to trade within this price channel as it reached the August high of $12,471 as it reached the resistance at a 1.414 Fib Extension level.
From there, Bitcoin rolled over and started to head lower. It broke beneath the rising price channel at the end of last week but found support at a parallel trend line. Bitcoin traded above this trend line over the past 3-days but broke beneath here today as it crashed beneath the $11,600 support (.236 Fib Retracement) to reach $11,500.
BTC price short term prediction: NEUTRAL
The break beneath the rising trend line has turned Bitcoin into a neutral trading condition in the short term. The coin would now have to break above $12,000 to turn bullish again. A break beneath $11,000 is likely to turn Bitcoin bearish.
If the sellers continue to drive Bitcoin beneath $11,500, the first level of support lies at $11,368 (downside 1.272 Fib Extension). This is followed by added support at $11,244 (downside 1.414 Fib Extension) and $11,080 (.382 Fib Retracement).
If the sellers continue to drive Bitcoin beneath $11,000, support is then expected at $10,800, $10,645 (.5 Fib Retracement), $10,400, and $10,200 (.618 Fib Retracement & 100-days EMA).
Where is the resistance toward the upside?
On the other side, if the buyers regroup and push higher, the first level of resistance lies at $11,600. This is followed by resistance at $11,800, $12,000, $12,126 (1.272 Fib Extension), and $12,471 (1.414 Fib Extension).
What are the technical indicators showing?
The RSI has also dropped beneath the mid-line to indicate the sellers are in control of the market momentum. Luckily, the Stochastic RSI is oversold and is primed for a bullish crossover signal which should put an end to the downtrend.
ETHEREUM PRICE ANALYSIS

What has been going on?
Looking at ETH/USD above, we can see that the coin surged to a 2-year high during mid-August 2020 as the coin reached $438 (August 2018 High). From there, Etheruem started to roll over as it headed lower over these past 2-weeks.
The coin initial found support around $410 but eventually went on to push beneath here as it headed lower to reach $390. It bounced from this support yesterday to break above $400 but failed to pass $408. Ethereum has since headed back beneath $400 to trade at $391 again.
ETH price short term prediction: BULLISH
Etheruem still remains bullish at this time. The coin would have to break beneath $360 to turn neutral and further beneath $310 to turn bearish.
If the sellers push lower, the first level of support lies at $390. This is followed by added support at $380, $361 (.382 Fib Retracement), $335 (.5 Fib Retracement), and $310 (.618 Fib Retracement).
Where is the resistance toward the upside?
On the other side, the first level of resistance lies at $400. This is followed by resistance at $420 and $438. Above $438, resistance can be expected at $460 (bearish .5 Fib Retracement) $474 (1.414 Fib Exnteison), $490, and $500.
What are the technical indicators showing?
Likewise, the RSI has dipped beneath the 50 line as the sellers take charge of the market momentum.
RIPPLE PRICE ANALYSIS

What has been going on?
XRP had surged as high as $0.3177 during August 2020. It was unable to overcome this resistance after numerous attempts to break above it. This caused XRP to roll over and head lower over the past few days. However, we can see that strong support has been found at the $0.28 level.
XRP price short term prediction: BULLISH
XRP is bullish right now but the resistance at $0.317 will need to be broken fairly soon. The coin would need to fall beneath $0.27 to turn neutral and further beneath $0.24 to turn bearish.
If the sellers do push lower, the first level of support is expected at $0.28. This is followed by added support at $0.27 (.382 Fib Retracement), $0.26, and $0.25 (.5 Fib Retracement). Beneath this, added support is then expected at $0.24 (100-day EMA), $0.23 (.618 Fib Retacement & 200-days EMA), and $0.218.
Where is the resistance toward the upside?
On the other side, if the buyers push higher, the first level of strong resistance lies at $0.3. This is followed by added resistance at $0.317 (bearish .886 Fib Retracement), $0.337, and $0.35.
If the bulls can break $0.35, resistance then lies at $0.361, $0.367 (1.272 Fib Extension), and $0.378.
What are the technical indicators showing?
The RSI has also penetrated beneath the mid-line her which suggests that the bears are in charge of the market momentum. If the RSI continues to drop, the bearish pressure will increase and is likely to cause Ripple to drop beneath the current $0.28 support and head lower.